
新疆农业科学 ›› 2023, Vol. 60 ›› Issue (4): 1028-1040.DOI: 10.6048/j.issn.1001-4330.2023.04.029
• 草业·植物保护·畜牧兽医·农业经济 • 上一篇
张泓1( ), 吐尔逊江·买买提2, 张少民1, 张军高1, 周小云1()
收稿日期:2022-09-20
出版日期:2023-04-20
发布日期:2023-05-06
通信作者:
周小云(1977-),男,重庆人,研究员,博士,研究方向为作物化控与生物技术,(E-mail)作者简介:张泓(1969-),女,新疆乌鲁木齐人,经济师,研究方向为农业经济管理,(E-mail)952771731@qq.com
基金资助:
ZHANG Hong1(), Turxujiang Maimait2, ZHANG Shaomin1, ZHANG Jungao1, ZHOU Xiaoyun1()
Received:2022-09-20
Online:2023-04-20
Published:2023-05-06
Correspondence author:
ZHOU Xiaoyun (1977 -), male, from Chongqing, researcher, doctor, research direction: crop chemical control and biotechnology, (E-mail)Supported by:摘要:
【目的】分析全国棉花生产布局变化,研究棉花生产时空变化特征与区域优势,为合理的配置棉花生产资源提供参考。【方法】基于全国近30 a来棉花总产量、播种面积、单产等数据,以全国主要种植棉花省(市、区)为研究单元,综合运用统计工具分析全国棉花生产时空变化和区域优势,研究棉花生产变化的总体特征、地域格局演变特征。【结果】1990年以来全国棉花总产量年际变化呈现两个阶段:波动上升时期(1991~2007年),除新疆显著上升外,大部分省(市、区)缓慢下降;波动下降时期(2008~2020年),黄河流域和长江流域棉区下降较快,西北内陆棉区尤其新疆显著增加。近30 a全国棉花总产量显著增加,由5.09×10⁹ kg增加至5.91×10⁹ kg,增加了16.11%,空间上呈现“东南-西北”格局;单产与总产量变化相似,在全国范围内持续增加;播种面积则不同,生产重心呈现出“由东向西”转移,逐渐向西北集中的态势。全国棉花总产量变化总体上以播种面积贡献为主导,其次互作主导,单产为最低,我国棉花的生产优势区域为新疆。【结论】30 a来全国棉花播种面积先减后增,生产集中程度不断增大,优势产区趋于稳定,单产逐步提升;棉花生产布局呈现全国棉花生产重心呈现出由南向北,再由北向西北内陆棉区(尤其是新疆)变迁的特点。
中图分类号:
张泓, 吐尔逊江·买买提, 张少民, 张军高, 周小云. 近30 a全国棉花生产区域时空变化及区域优势分析[J]. 新疆农业科学, 2023, 60(4): 1028-1040.
ZHANG Hong, Turxujiang Maimait, ZHANG Shaomin, ZHANG Jungao, ZHOU Xiaoyun. Spatio-temporal variation and regional advantages of cotton production in recent 30 years in China[J]. Xinjiang Agricultural Sciences, 2023, 60(4): 1028-1040.
| 项目 Item | 总产量Total output | 单产Per unit area | 总面积Total area | |||
|---|---|---|---|---|---|---|
| 年份 Year | (109 kg) | 年份 Year | (103 kg/hm2) | 年份 Year | (106 hm2) | |
| 期初值 Initial value | 1991 | 5.09 | 1991 | 0.78 | 1991 | 6.54 |
| 期末值 Final value | 2020 | 5.91 | 2020 | 1.84 | 2020 | 3.17 |
| 增长率区间 Growth rate interval(%) | - | -9.58~15.82 | - | -5.49~10.79 | - | -27.06~22.14 |
| 平均增长率 Average growth rate(%) | - | 0.92 | - | 2.88 | - | -1.19 |
| 最大增长率 Maximum growth rate(%) | 2005 | 15.82 | 2005 | 10.79 | 2003 | 22.14 |
| 最小增长率 Minimum growth rate(%) | 1993 | -9.58 | 2009 | -5.49 | 1993 | -27.06 |
表1 1991~2020年全国棉花生产基本数据
Tab.1 Basical data of China's cotton production in recent 30 years (1991-2020)
| 项目 Item | 总产量Total output | 单产Per unit area | 总面积Total area | |||
|---|---|---|---|---|---|---|
| 年份 Year | (109 kg) | 年份 Year | (103 kg/hm2) | 年份 Year | (106 hm2) | |
| 期初值 Initial value | 1991 | 5.09 | 1991 | 0.78 | 1991 | 6.54 |
| 期末值 Final value | 2020 | 5.91 | 2020 | 1.84 | 2020 | 3.17 |
| 增长率区间 Growth rate interval(%) | - | -9.58~15.82 | - | -5.49~10.79 | - | -27.06~22.14 |
| 平均增长率 Average growth rate(%) | - | 0.92 | - | 2.88 | - | -1.19 |
| 最大增长率 Maximum growth rate(%) | 2005 | 15.82 | 2005 | 10.79 | 2003 | 22.14 |
| 最小增长率 Minimum growth rate(%) | 1993 | -9.58 | 2009 | -5.49 | 1993 | -27.06 |
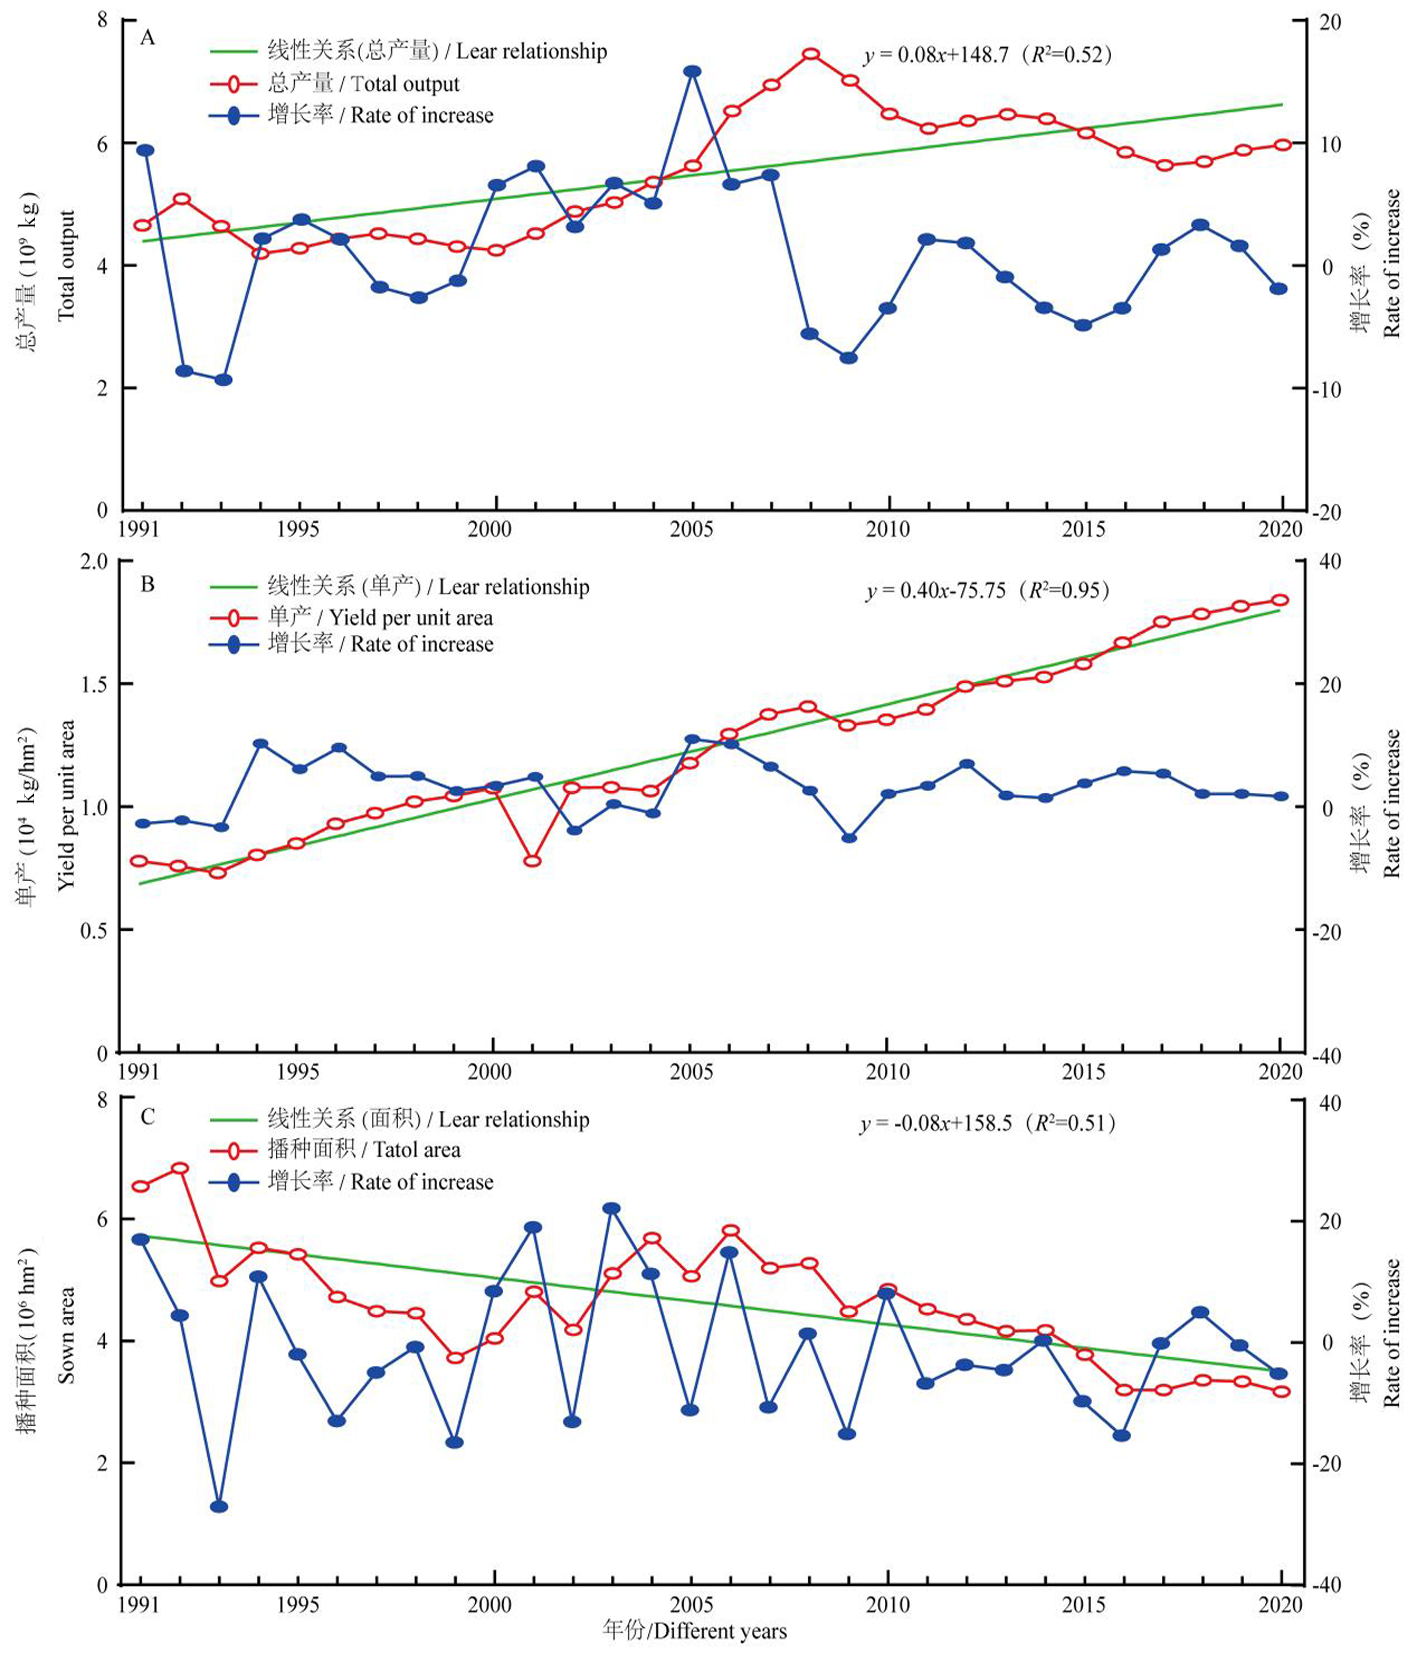
图1 1991~2020年全国棉花生产的增长变化
Fig.1 Growth curve of cotton production in China in recent 30 years (1991-2020)
| 区域 Region | 时间段 Time interval | 面积变化量 Change in sown area (hm2) | 总产变化量 Change in total production (103 kg) | 单产 变化量 Change in yield (kg/hm2) | 面积贡献率 Area contribution rate (%) | 单产 贡献率 Yield contribution rate (%) | 面积单产 共同作用贡献率 Combined effect of area and yield contribution rate(%) |
|---|---|---|---|---|---|---|---|
| 全国 Nationwide | 1991~1995 | -1 116 867.00 | -459 793 000.00 | 73.51 | 98.88 | # | 1.12 |
| 1996~2000 | -681 000.00 | -1 272 333.33 | 144.44 | 97.03 | # | 2.97 | |
| 2001~2005 | 251 998.70 | 1 637 800 729.00 | 53.36 | 98.67 | # | 1.33 | |
| 2006~2010 | -1 449 698.00 | -773 003 170.00 | 89.20 | 98.47 | # | 1.53 | |
| 2011~2015 | -749 005.00 | -449 197 417.80 | 155.12 | 96.67 | # | 3.33 | |
| 2016~2020 | -29 423.70 | 209 256 636.40 | 172.20 | 95.74 | # | 4.26 | |
| 长江流域 Yangtze River Basin | 1991~1995 | -140 633.33 | -14 666 666.70 | 14.08 | 99.24 | # | 0.76 |
| 1996~2000 | 644 100.00 | 612 857 333.00 | -27.29 | 98.51 | # | 1.49 | |
| 2001~2005 | 13 344.33 | -204 005 877.00 | -127.33 | 90.00 | # | 10.00 | |
| 2006~2010 | 73 147.75 | 61 212 131.20 | -54.99 | 96.07 | # | 3.93 | |
| 2011~2015 | 582 324.97 | 614 964 553.00 | 161.75 | 89.80 | # | 10.20 | |
| 2016~2020 | 331 978.36 | 402 527 560.00 | -22.03 | 96.23 | # | 3.77 | |
| 黄河流域 Yellow River Basin | 1991~1995 | 1 439 200.00 | 819 666 667.00 | 157.10 | 96.19 | # | 3.81 |
| 1996~2000 | 258 398.00 | -187 231 233.00 | -223.52 | 89.94 | # | 10.06 | |
| 2001~2005 | -233 114.20 | -648 213 548.00 | -159.65 | 92.94 | # | 7.06 | |
| 2006~2010 | 651 616.33 | 563 749 564.00 | -51.55 | 98.06 | # | 1.94 | |
| 2011~2015 | 895 654.56 | 728 548 434.00 | -81.75 | 95.98 | # | 4.02 | |
| 2016~2020 | 541 366.73 | 480 329 655.00 | 144.23 | 86.32 | # | 13.68 | |
| 西北内陆 Inland Northwest | 1991~1995 | -206 033.33 | -356 333 333.00 | 22.43 | 96.97 | # | 3.03 |
| 1996~2000 | -227 810.00 | -433 489 650.00 | -152.87 | 84.31 | # | 15.69 | |
| 2001~2005 | -37 843.33 | -525 590 802.00 | -85.42 | 90.00 | # | 10.00 | |
| 2006~2010 | -163 906.67 | -234 972 695.00 | -10.92 | 98.95 | # | 1.05 | |
| 2011~2015 | -244 020.00 | -584 032 684.00 | -32.48 | 98.59 | # | 1.41 | |
| 2016~2020 | -700 109.99 | -1 209 416 924.00 | -128.02 | 93.75 | # | 6.25 |
表2 1991~2020年各时段全国棉花总产量贡献率变化
Tab.2 The change of cotton yield contribution rate in each period of China in recent 30 years(1991-2020)
| 区域 Region | 时间段 Time interval | 面积变化量 Change in sown area (hm2) | 总产变化量 Change in total production (103 kg) | 单产 变化量 Change in yield (kg/hm2) | 面积贡献率 Area contribution rate (%) | 单产 贡献率 Yield contribution rate (%) | 面积单产 共同作用贡献率 Combined effect of area and yield contribution rate(%) |
|---|---|---|---|---|---|---|---|
| 全国 Nationwide | 1991~1995 | -1 116 867.00 | -459 793 000.00 | 73.51 | 98.88 | # | 1.12 |
| 1996~2000 | -681 000.00 | -1 272 333.33 | 144.44 | 97.03 | # | 2.97 | |
| 2001~2005 | 251 998.70 | 1 637 800 729.00 | 53.36 | 98.67 | # | 1.33 | |
| 2006~2010 | -1 449 698.00 | -773 003 170.00 | 89.20 | 98.47 | # | 1.53 | |
| 2011~2015 | -749 005.00 | -449 197 417.80 | 155.12 | 96.67 | # | 3.33 | |
| 2016~2020 | -29 423.70 | 209 256 636.40 | 172.20 | 95.74 | # | 4.26 | |
| 长江流域 Yangtze River Basin | 1991~1995 | -140 633.33 | -14 666 666.70 | 14.08 | 99.24 | # | 0.76 |
| 1996~2000 | 644 100.00 | 612 857 333.00 | -27.29 | 98.51 | # | 1.49 | |
| 2001~2005 | 13 344.33 | -204 005 877.00 | -127.33 | 90.00 | # | 10.00 | |
| 2006~2010 | 73 147.75 | 61 212 131.20 | -54.99 | 96.07 | # | 3.93 | |
| 2011~2015 | 582 324.97 | 614 964 553.00 | 161.75 | 89.80 | # | 10.20 | |
| 2016~2020 | 331 978.36 | 402 527 560.00 | -22.03 | 96.23 | # | 3.77 | |
| 黄河流域 Yellow River Basin | 1991~1995 | 1 439 200.00 | 819 666 667.00 | 157.10 | 96.19 | # | 3.81 |
| 1996~2000 | 258 398.00 | -187 231 233.00 | -223.52 | 89.94 | # | 10.06 | |
| 2001~2005 | -233 114.20 | -648 213 548.00 | -159.65 | 92.94 | # | 7.06 | |
| 2006~2010 | 651 616.33 | 563 749 564.00 | -51.55 | 98.06 | # | 1.94 | |
| 2011~2015 | 895 654.56 | 728 548 434.00 | -81.75 | 95.98 | # | 4.02 | |
| 2016~2020 | 541 366.73 | 480 329 655.00 | 144.23 | 86.32 | # | 13.68 | |
| 西北内陆 Inland Northwest | 1991~1995 | -206 033.33 | -356 333 333.00 | 22.43 | 96.97 | # | 3.03 |
| 1996~2000 | -227 810.00 | -433 489 650.00 | -152.87 | 84.31 | # | 15.69 | |
| 2001~2005 | -37 843.33 | -525 590 802.00 | -85.42 | 90.00 | # | 10.00 | |
| 2006~2010 | -163 906.67 | -234 972 695.00 | -10.92 | 98.95 | # | 1.05 | |
| 2011~2015 | -244 020.00 | -584 032 684.00 | -32.48 | 98.59 | # | 1.41 | |
| 2016~2020 | -700 109.99 | -1 209 416 924.00 | -128.02 | 93.75 | # | 6.25 |
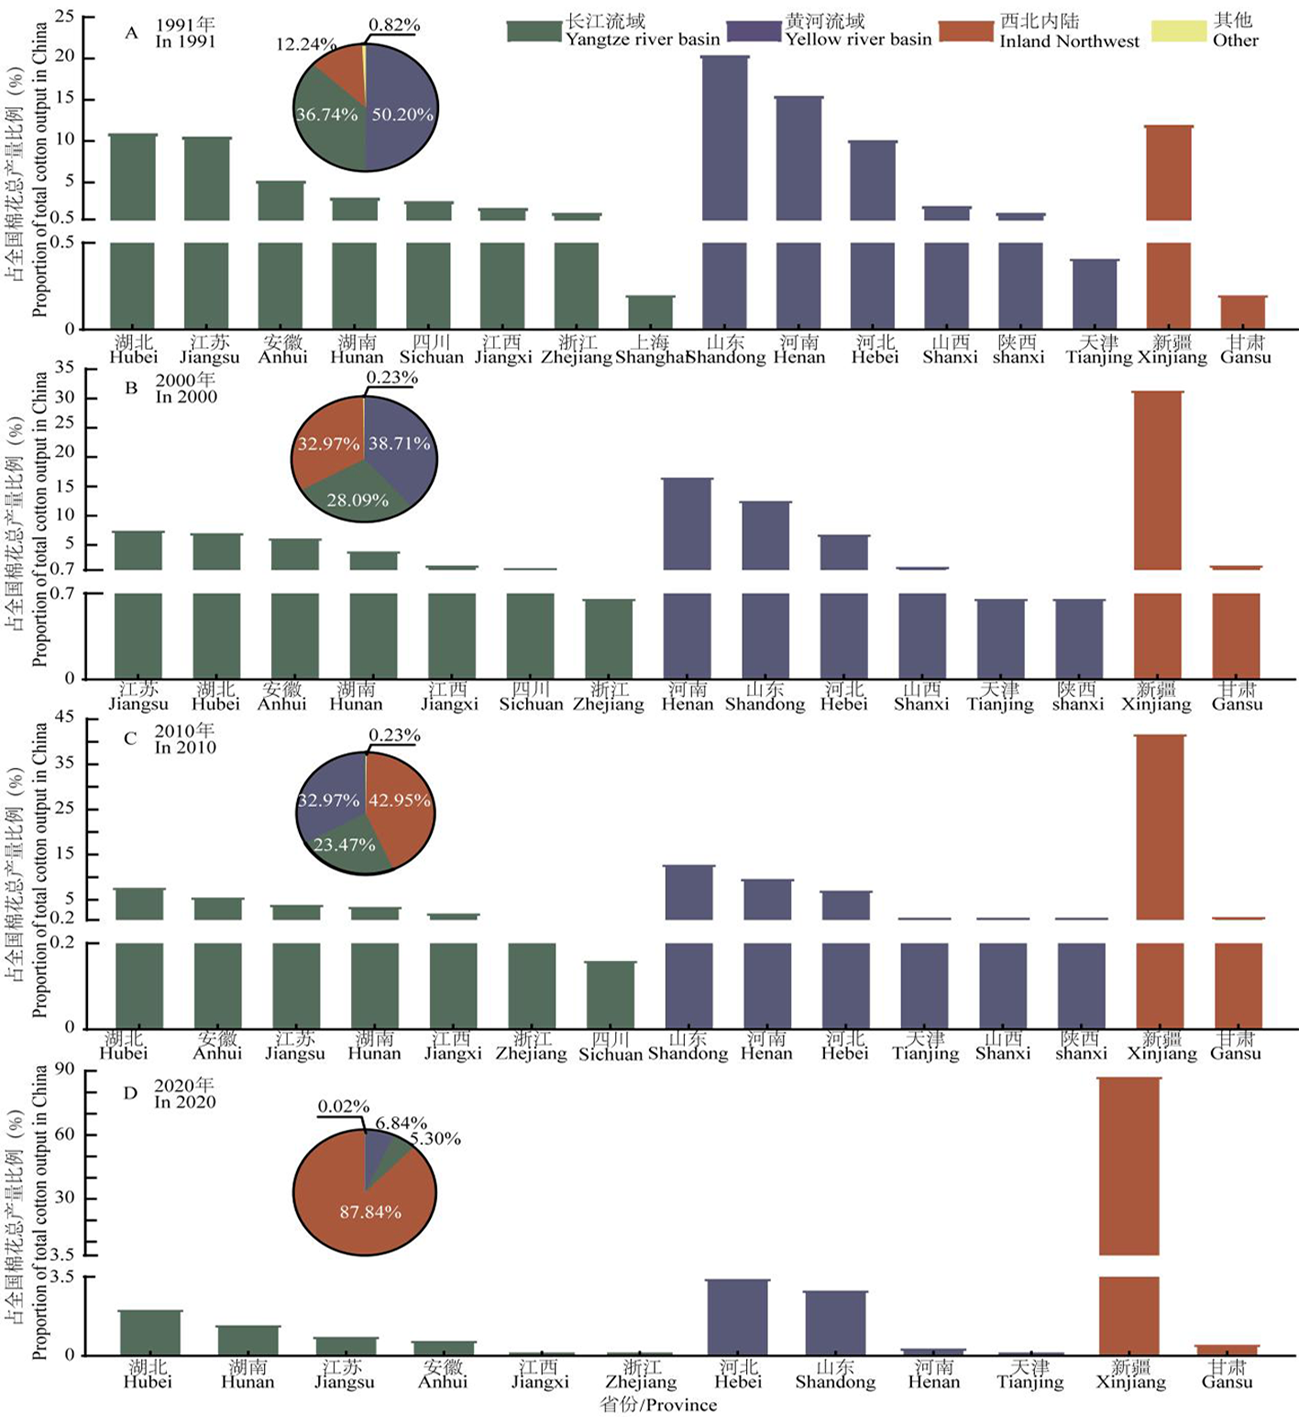
图2 不同年份各主要省(市、区)棉花总产量的比较 注:饼图百分数表示相应棉区总产量占全国的百分比,柱状图表示相应省(市、区)总产量占全国的百分比,绿色表示长江流域棉区,蓝色表示黄河流域棉区,红色表示黄河流域棉区,黄色表示其他棉区
Fig.2 Comparison of cotton total output in different main provinces and regions in different years Note: The percentage of pie chart in the figure indicates the percentage of the total output of corresponding cotton areas in the country, and the histogram in the figure indicates the percentage of the total output of corresponding provinces in the country. Green indicates the cotton area in the Yangtze River basin, blue indicates the cotton area in the Yellow River basin, red indicates the cotton area in the Yellow River basin, and yellow indicates other cotton area
| 棉区 Cotton area | 省(市、区) provinces (city,regions) | 1991 | 2000 | 2010 | 2020 | |||||||||||||||||||
|---|---|---|---|---|---|---|---|---|---|---|---|---|---|---|---|---|---|---|---|---|---|---|---|---|
| 总产量 Total output (109kg) | 单产 Per unit area (104 kg/hm2) | 播种面积 Sown area (106 hm2) | 总产量 Total output (109kg) | 单产 Per unit area (104 kg/hm2) | 播种面积 Sown area (106 hm2) | 总产量 Total output (109kg) | 单产 Per unit area (104 kg/hm2) | 播种面积 Sown area (106 hm2) | 总产量 Total output (109kg) | 单产 Per unit area (104 kg/hm2) | 播种面积 Sown area (106 hm2) | |||||||||||||
| 全国whole country | 5.09 | 0.78 | 0.65 | 4.52 | 1.08 | 4.04 | 6.31 | 1.28 | 4.85 | 5.84 | 1.84 | 3.17 | ||||||||||||
| 长江流域 Yangtze River Basin | 上海 | 0.01 | 1.05 | # | # | 1.18 | # | # | 1.79 | # | # | 0.89 | # | |||||||||||
| 江苏 | 0.52 | 0.87 | 0.06 | 0.34 | 1.07 | 0.30 | 0.25 | 1.05 | 0.24 | 0.01 | 1.33 | 0.01 | ||||||||||||
| 浙江 | 0.07 | 0.96 | 0.01 | 0.03 | 1.10 | 0.03 | 0.03 | 1.43 | 0.02 | 0.01 | 1.42 | 0.00 | ||||||||||||
| 安徽 | 0.26 | 0.71 | 0.04 | 0.28 | 0.84 | 0.31 | 0.35 | 0.99 | 0.34 | 0.04 | 0.86 | 0.05 | ||||||||||||
| 江西 | 0.10 | 0.95 | 0.01 | 0.07 | 1.01 | 0.07 | 0.13 | 1.68 | 0.08 | 0.05 | 1.54 | 0.04 | ||||||||||||
| 湖北 | 0.54 | 1.14 | 0.05 | 0.32 | 0.98 | 0.32 | 0.49 | 1.03 | 0.48 | 0.12 | 0.87 | 0.13 | ||||||||||||
| 湖南 | 0.16 | 1.11 | 0.01 | 0.18 | 1.16 | 0.15 | 0.22 | 1.29 | 0.18 | 0.08 | 1.30 | 0.06 | ||||||||||||
| 重庆 | # | # | # | # | 0.49 | # | # | 0.62 | # | # | # | # | ||||||||||||
| 四川 | 0.14 | 0.95 | 0.01 | 0.05 | 0.90 | 0.07 | 0.01 | 0.9 | 0.02 | # | 0.96 | # | ||||||||||||
| 黄河流域 Yellow River Basin | 北京 | # | 0.99 | # | # | 1.05 | # | # | 1.20 | # | # | 0.71 | # | |||||||||||
| 天津 | 0.02 | 0.76 | # | 0.03 | 1.18 | 0.02 | 0.07 | 1.23 | 0.05 | 0.01 | 1.23 | 0.01 | ||||||||||||
| 河北 | 0.50 | 0.55 | 0.10 | 0.31 | 0.94 | 0.31 | 0.61 | 1.00 | 0.58 | 0.20 | 1.12 | 0.19 | ||||||||||||
| 山西 | 0.11 | 0.75 | 0.01 | 0.06 | 0.94 | 0.04 | 0.07 | 1.17 | 0.06 | # | 0.89 | # | ||||||||||||
| 内蒙古 | # | 0.90 | # | # | # | # | # | 1.38 | # | # | 0.98 | # | ||||||||||||
| 山东 | 1.00 | 0.67 | 0.16 | 0.57 | 1.02 | 0.57 | 0.81 | 1.05 | 0.77 | 0.17 | 1.24 | 0.14 | ||||||||||||
| 河南 | 0.76 | 0.72 | 0.12 | 0.75 | 0.94 | 0.78 | 0.45 | 0.96 | 0.47 | 0.02 | 1.04 | 0.02 | ||||||||||||
| 陕西 | 0.07 | 0.59 | 0.01 | 0.03 | 0.87 | 0.03 | 0.07 | 1.36 | 0.05 | # | 0.81 | # | ||||||||||||
| 西北内陆 Inland Northwest | 甘肃 | 0.01 | 1.42 | # | 0.07 | 1.60 | 0.03 | 0.08 | 1.63 | 0.05 | 0.03 | 1.80 | 0.02 | |||||||||||
| 新疆 | 0.59 | 1.10 | 0.05 | 1.42 | 1.36 | 1.01 | 2.63 | 1.75 | 1.46 | 5.10 | 2.03 | 2.50 | ||||||||||||
表3 1991~2020年全国主要省(市、区)棉花生产基本数据
Tab.3 Basical data of major cotton producing provinces(city,regions) in China in recent 30 years (1991-2020)
| 棉区 Cotton area | 省(市、区) provinces (city,regions) | 1991 | 2000 | 2010 | 2020 | |||||||||||||||||||
|---|---|---|---|---|---|---|---|---|---|---|---|---|---|---|---|---|---|---|---|---|---|---|---|---|
| 总产量 Total output (109kg) | 单产 Per unit area (104 kg/hm2) | 播种面积 Sown area (106 hm2) | 总产量 Total output (109kg) | 单产 Per unit area (104 kg/hm2) | 播种面积 Sown area (106 hm2) | 总产量 Total output (109kg) | 单产 Per unit area (104 kg/hm2) | 播种面积 Sown area (106 hm2) | 总产量 Total output (109kg) | 单产 Per unit area (104 kg/hm2) | 播种面积 Sown area (106 hm2) | |||||||||||||
| 全国whole country | 5.09 | 0.78 | 0.65 | 4.52 | 1.08 | 4.04 | 6.31 | 1.28 | 4.85 | 5.84 | 1.84 | 3.17 | ||||||||||||
| 长江流域 Yangtze River Basin | 上海 | 0.01 | 1.05 | # | # | 1.18 | # | # | 1.79 | # | # | 0.89 | # | |||||||||||
| 江苏 | 0.52 | 0.87 | 0.06 | 0.34 | 1.07 | 0.30 | 0.25 | 1.05 | 0.24 | 0.01 | 1.33 | 0.01 | ||||||||||||
| 浙江 | 0.07 | 0.96 | 0.01 | 0.03 | 1.10 | 0.03 | 0.03 | 1.43 | 0.02 | 0.01 | 1.42 | 0.00 | ||||||||||||
| 安徽 | 0.26 | 0.71 | 0.04 | 0.28 | 0.84 | 0.31 | 0.35 | 0.99 | 0.34 | 0.04 | 0.86 | 0.05 | ||||||||||||
| 江西 | 0.10 | 0.95 | 0.01 | 0.07 | 1.01 | 0.07 | 0.13 | 1.68 | 0.08 | 0.05 | 1.54 | 0.04 | ||||||||||||
| 湖北 | 0.54 | 1.14 | 0.05 | 0.32 | 0.98 | 0.32 | 0.49 | 1.03 | 0.48 | 0.12 | 0.87 | 0.13 | ||||||||||||
| 湖南 | 0.16 | 1.11 | 0.01 | 0.18 | 1.16 | 0.15 | 0.22 | 1.29 | 0.18 | 0.08 | 1.30 | 0.06 | ||||||||||||
| 重庆 | # | # | # | # | 0.49 | # | # | 0.62 | # | # | # | # | ||||||||||||
| 四川 | 0.14 | 0.95 | 0.01 | 0.05 | 0.90 | 0.07 | 0.01 | 0.9 | 0.02 | # | 0.96 | # | ||||||||||||
| 黄河流域 Yellow River Basin | 北京 | # | 0.99 | # | # | 1.05 | # | # | 1.20 | # | # | 0.71 | # | |||||||||||
| 天津 | 0.02 | 0.76 | # | 0.03 | 1.18 | 0.02 | 0.07 | 1.23 | 0.05 | 0.01 | 1.23 | 0.01 | ||||||||||||
| 河北 | 0.50 | 0.55 | 0.10 | 0.31 | 0.94 | 0.31 | 0.61 | 1.00 | 0.58 | 0.20 | 1.12 | 0.19 | ||||||||||||
| 山西 | 0.11 | 0.75 | 0.01 | 0.06 | 0.94 | 0.04 | 0.07 | 1.17 | 0.06 | # | 0.89 | # | ||||||||||||
| 内蒙古 | # | 0.90 | # | # | # | # | # | 1.38 | # | # | 0.98 | # | ||||||||||||
| 山东 | 1.00 | 0.67 | 0.16 | 0.57 | 1.02 | 0.57 | 0.81 | 1.05 | 0.77 | 0.17 | 1.24 | 0.14 | ||||||||||||
| 河南 | 0.76 | 0.72 | 0.12 | 0.75 | 0.94 | 0.78 | 0.45 | 0.96 | 0.47 | 0.02 | 1.04 | 0.02 | ||||||||||||
| 陕西 | 0.07 | 0.59 | 0.01 | 0.03 | 0.87 | 0.03 | 0.07 | 1.36 | 0.05 | # | 0.81 | # | ||||||||||||
| 西北内陆 Inland Northwest | 甘肃 | 0.01 | 1.42 | # | 0.07 | 1.60 | 0.03 | 0.08 | 1.63 | 0.05 | 0.03 | 1.80 | 0.02 | |||||||||||
| 新疆 | 0.59 | 1.10 | 0.05 | 1.42 | 1.36 | 1.01 | 2.63 | 1.75 | 1.46 | 5.10 | 2.03 | 2.50 | ||||||||||||
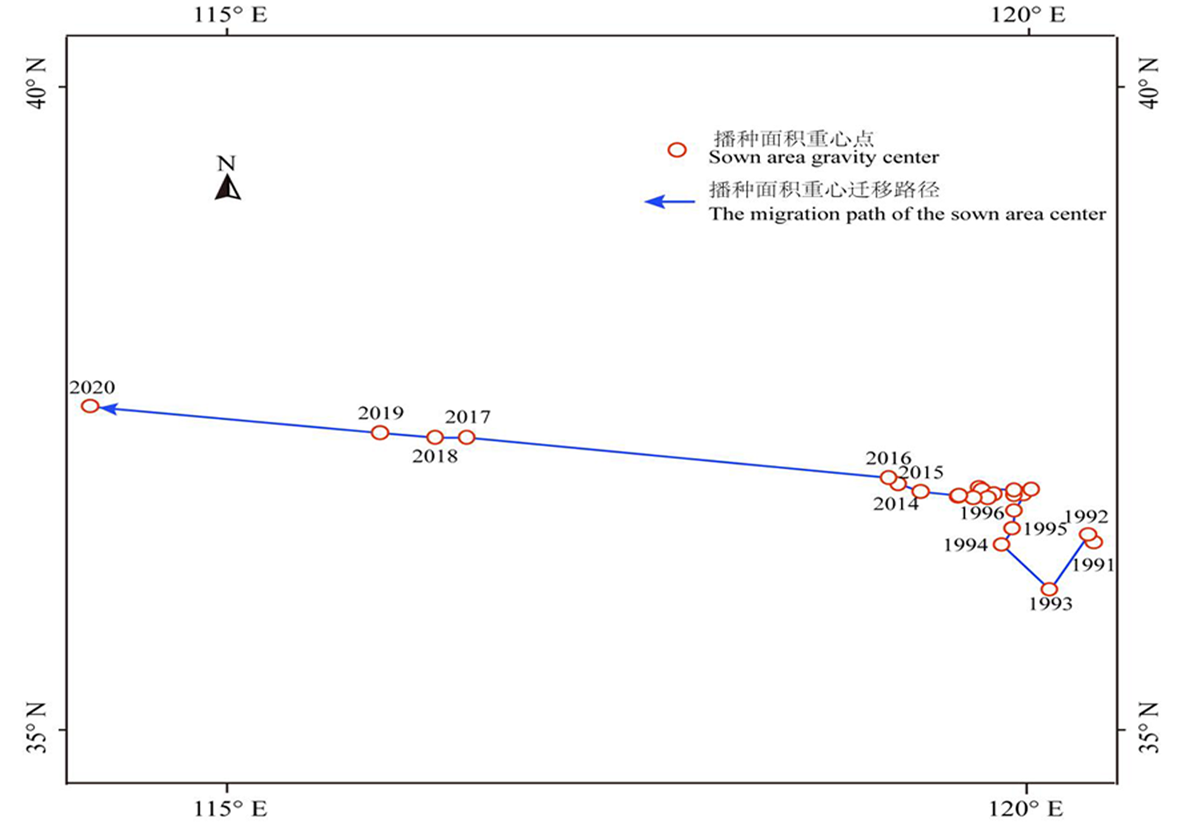
图3 1991~2020全国棉花面积重心变化
Fig.3 Variations of the gravity of cotton area of China in 1991-2020
| 棉区 Cotton area | 省(市、区) Provinces(city,regions) | 指标 Index | 1991年 | 2000年 | 2010年 | 2020年 | 平均值 Means | |||
|---|---|---|---|---|---|---|---|---|---|---|
| 长江流域 Yangtze River Basin | 上海 Shanghai | SAI | 0.51 | 0.07 | 0.20 | # | 0.20 | |||
| EAI | 1.34 | 1.06 | 1.18 | 0.73 | 1.08 | |||||
| AAI | 0.83 | 0.27 | 0.49 | # | 0.40 | |||||
| 江苏 Jiangsh | SAI | 1.56 | 1.44 | 1.02 | 0.06 | 1.02 | ||||
| EAI | 1.16 | 0.97 | 0.90 | 0.68 | 0.93 | |||||
| AAI | 1.35 | 1.18 | 0.96 | 0.20 | 0.92 | |||||
| 长江流域 Yangtze River Basin | 浙江 Zhejiang | SAI | 0.36 | 0.29 | 0.28 | 0.13 | 0.27 | |||
| EAI | 1.28 | 1.01 | 1.15 | 0.76 | 1.05 | |||||
| AAI | 0.68 | 0.54 | 0.57 | 0.31 | 0.53 | |||||
| 安徽 Anhui | SAI | 1.13 | 1.32 | 1.26 | 0.31 | 1.01 | ||||
| EAI | 0.78 | 0.81 | 0.75 | 0.43 | 0.69 | |||||
| AAI | 0.94 | 1.03 | 0.97 | 0.37 | 0.83 | |||||
| 江西 Jiangxi | SAI | 0.45 | 0.47 | 0.48 | 0.33 | 0.43 | ||||
| EAI | 1.09 | 0.90 | 1.33 | 0.81 | 1.03 | |||||
| AAI | 0.70 | 0.65 | 0.80 | 0.52 | 0.67 | |||||
| 湖北 Hubei | SAI | 1.42 | 1.62 | 1.99 | 0.86 | 1.47 | ||||
| EAI | 1.22 | 0.88 | 0.80 | 0.45 | 0.84 | |||||
| AAI | 1.32 | 1.19 | 1.26 | 0.62 | 1.10 | |||||
| 湖南 Hunan | SAI | 0.38 | 0.71 | 0.71 | 0.37 | 0.54 | ||||
| EAI | 1.28 | 0.99 | 1.06 | 0.67 | 1.00 | |||||
| AAI | 0.70 | 0.84 | 0.87 | 0.50 | 0.73 | |||||
| 重庆 Chongqin | SAI | # | 0.01 | # | # | # | ||||
| EAI | # | 0.39 | 0.51 | # | 0.23 | |||||
| AAI | # | 0.06 | # | # | 0.02 | |||||
| 四川 Sichuan | SAI | 0.26 | 0.28 | 0.06 | 0.01 | 0.15 | ||||
| EAI | 1.14 | 0.77 | 0.71 | 0.51 | 0.78 | |||||
| AAI | 0.54 | 0.46 | 0.21 | 0.07 | 0.32 | |||||
| 黄河流域 Yellow River Basin | 北京 Beijiang | SAI | 0.15 | 0.13 | 0.04 | # | 0.08 | |||
| EAI | 1.02 | 0.90 | 0.94 | 0.59 | 0.86 | |||||
| AAI | 0.39 | 0.34 | 0.19 | # | 0.23 | |||||
| 天津 Tianjing | SAI | 1.18 | 1.09 | 3.74 | 0.98 | 1.75 | ||||
| EAI | 0.98 | 1.07 | 0.98 | 0.70 | 0.93 | |||||
| AAI | 1.08 | 1.08 | 1.91 | 0.83 | 1.23 | |||||
| 河北 Hebei | SAI | 2.48 | 1.32 | 2.21 | 1.24 | 1.81 | ||||
| EAI | 0.76 | 0.89 | 0.80 | 0.59 | 0.76 | |||||
| AAI | 1.37 | 1.08 | 1.33 | 0.86 | 1.16 | |||||
| 山西 Shangxi | SAI | 0.85 | 0.41 | 0.52 | 0.02 | 0.45 | ||||
| EAI | 0.88 | 0.95 | 0.96 | 0.74 | 0.88 | |||||
| AAI | 0.86 | 0.62 | 0.71 | 0.12 | 0.58 | |||||
| 内蒙古 Nei Monggol | SAI | # | # | # | # | # | ||||
| EAI | 1.33 | # | 1.03 | 0.77 | 0.78 | |||||
| AAI | # | # | # | # | # | |||||
| 山东 Shangdong | SAI | 3.25 | 1.97 | 2.35 | 0.69 | 2.07 | ||||
| EAI | 1.00 | 0.95 | 0.77 | 0.69 | 0.85 | |||||
| AAI | 1.8 | 1.37 | 1.35 | 0.69 | 1.30 | |||||
| 黄河流域 Yellow River Basin | 河南 Hennan | SAI | 2.27 | 2.29 | 1.09 | 0.06 | 1.43 | |||
| EAI | 0.91 | 0.83 | 0.78 | 0.60 | 0.78 | |||||
| AAI | 1.44 | 1.38 | 0.92 | 0.19 | 0.98 | |||||
| 陕西 Shanxi | SAI | 0.63 | 0.26 | 0.40 | 0.01 | 0.33 | ||||
| EAI | 0.78 | 0.83 | 1.11 | 0.56 | 0.82 | |||||
| AAI | 0.70 | 0.46 | 0.67 | 0.07 | 0.48 | |||||
| 西北内陆 Inland Northwest | 甘肃 Gansu | SAI | 0.05 | 0.36 | 0.40 | 0.22 | 0.26 | |||
| EAI | 1.78 | 1.52 | 1.28 | 0.97 | 1.39 | |||||
| AAI | 0.30 | 0.74 | 0.72 | 0.46 | 0.56 | |||||
| 新疆 Xinjiang | SAI | 4.12 | 11.54 | 10.17 | 21.06 | 11.72 | ||||
| EAI | 1.34 | 1.32 | 1.38 | 1.11 | 1.29 | |||||
| AAI | 2.35 | 3.90 | 3.75 | 4.83 | 3.71 | |||||
表4 1991~2020年全国棉花主产省(市、区)优势指数比较
Tab.4 Comparison of advantage index of major cotton provinces(city,regions) and regions in China in recent 30 years (1991-2020)
| 棉区 Cotton area | 省(市、区) Provinces(city,regions) | 指标 Index | 1991年 | 2000年 | 2010年 | 2020年 | 平均值 Means | |||
|---|---|---|---|---|---|---|---|---|---|---|
| 长江流域 Yangtze River Basin | 上海 Shanghai | SAI | 0.51 | 0.07 | 0.20 | # | 0.20 | |||
| EAI | 1.34 | 1.06 | 1.18 | 0.73 | 1.08 | |||||
| AAI | 0.83 | 0.27 | 0.49 | # | 0.40 | |||||
| 江苏 Jiangsh | SAI | 1.56 | 1.44 | 1.02 | 0.06 | 1.02 | ||||
| EAI | 1.16 | 0.97 | 0.90 | 0.68 | 0.93 | |||||
| AAI | 1.35 | 1.18 | 0.96 | 0.20 | 0.92 | |||||
| 长江流域 Yangtze River Basin | 浙江 Zhejiang | SAI | 0.36 | 0.29 | 0.28 | 0.13 | 0.27 | |||
| EAI | 1.28 | 1.01 | 1.15 | 0.76 | 1.05 | |||||
| AAI | 0.68 | 0.54 | 0.57 | 0.31 | 0.53 | |||||
| 安徽 Anhui | SAI | 1.13 | 1.32 | 1.26 | 0.31 | 1.01 | ||||
| EAI | 0.78 | 0.81 | 0.75 | 0.43 | 0.69 | |||||
| AAI | 0.94 | 1.03 | 0.97 | 0.37 | 0.83 | |||||
| 江西 Jiangxi | SAI | 0.45 | 0.47 | 0.48 | 0.33 | 0.43 | ||||
| EAI | 1.09 | 0.90 | 1.33 | 0.81 | 1.03 | |||||
| AAI | 0.70 | 0.65 | 0.80 | 0.52 | 0.67 | |||||
| 湖北 Hubei | SAI | 1.42 | 1.62 | 1.99 | 0.86 | 1.47 | ||||
| EAI | 1.22 | 0.88 | 0.80 | 0.45 | 0.84 | |||||
| AAI | 1.32 | 1.19 | 1.26 | 0.62 | 1.10 | |||||
| 湖南 Hunan | SAI | 0.38 | 0.71 | 0.71 | 0.37 | 0.54 | ||||
| EAI | 1.28 | 0.99 | 1.06 | 0.67 | 1.00 | |||||
| AAI | 0.70 | 0.84 | 0.87 | 0.50 | 0.73 | |||||
| 重庆 Chongqin | SAI | # | 0.01 | # | # | # | ||||
| EAI | # | 0.39 | 0.51 | # | 0.23 | |||||
| AAI | # | 0.06 | # | # | 0.02 | |||||
| 四川 Sichuan | SAI | 0.26 | 0.28 | 0.06 | 0.01 | 0.15 | ||||
| EAI | 1.14 | 0.77 | 0.71 | 0.51 | 0.78 | |||||
| AAI | 0.54 | 0.46 | 0.21 | 0.07 | 0.32 | |||||
| 黄河流域 Yellow River Basin | 北京 Beijiang | SAI | 0.15 | 0.13 | 0.04 | # | 0.08 | |||
| EAI | 1.02 | 0.90 | 0.94 | 0.59 | 0.86 | |||||
| AAI | 0.39 | 0.34 | 0.19 | # | 0.23 | |||||
| 天津 Tianjing | SAI | 1.18 | 1.09 | 3.74 | 0.98 | 1.75 | ||||
| EAI | 0.98 | 1.07 | 0.98 | 0.70 | 0.93 | |||||
| AAI | 1.08 | 1.08 | 1.91 | 0.83 | 1.23 | |||||
| 河北 Hebei | SAI | 2.48 | 1.32 | 2.21 | 1.24 | 1.81 | ||||
| EAI | 0.76 | 0.89 | 0.80 | 0.59 | 0.76 | |||||
| AAI | 1.37 | 1.08 | 1.33 | 0.86 | 1.16 | |||||
| 山西 Shangxi | SAI | 0.85 | 0.41 | 0.52 | 0.02 | 0.45 | ||||
| EAI | 0.88 | 0.95 | 0.96 | 0.74 | 0.88 | |||||
| AAI | 0.86 | 0.62 | 0.71 | 0.12 | 0.58 | |||||
| 内蒙古 Nei Monggol | SAI | # | # | # | # | # | ||||
| EAI | 1.33 | # | 1.03 | 0.77 | 0.78 | |||||
| AAI | # | # | # | # | # | |||||
| 山东 Shangdong | SAI | 3.25 | 1.97 | 2.35 | 0.69 | 2.07 | ||||
| EAI | 1.00 | 0.95 | 0.77 | 0.69 | 0.85 | |||||
| AAI | 1.8 | 1.37 | 1.35 | 0.69 | 1.30 | |||||
| 黄河流域 Yellow River Basin | 河南 Hennan | SAI | 2.27 | 2.29 | 1.09 | 0.06 | 1.43 | |||
| EAI | 0.91 | 0.83 | 0.78 | 0.60 | 0.78 | |||||
| AAI | 1.44 | 1.38 | 0.92 | 0.19 | 0.98 | |||||
| 陕西 Shanxi | SAI | 0.63 | 0.26 | 0.40 | 0.01 | 0.33 | ||||
| EAI | 0.78 | 0.83 | 1.11 | 0.56 | 0.82 | |||||
| AAI | 0.70 | 0.46 | 0.67 | 0.07 | 0.48 | |||||
| 西北内陆 Inland Northwest | 甘肃 Gansu | SAI | 0.05 | 0.36 | 0.40 | 0.22 | 0.26 | |||
| EAI | 1.78 | 1.52 | 1.28 | 0.97 | 1.39 | |||||
| AAI | 0.30 | 0.74 | 0.72 | 0.46 | 0.56 | |||||
| 新疆 Xinjiang | SAI | 4.12 | 11.54 | 10.17 | 21.06 | 11.72 | ||||
| EAI | 1.34 | 1.32 | 1.38 | 1.11 | 1.29 | |||||
| AAI | 2.35 | 3.90 | 3.75 | 4.83 | 3.71 | |||||
| [1] |
喻树迅. 中国棉花产业百年发展历程[J]. 农学学报, 2018, 8(1): 93-91.
DOI |
| YU Shuxun. The Development of cotton production in the recent hundred years of China[J]. Journal of Agriculture, 2018, 8(1): 85-91. | |
| [2] | 邹晓蔓, 傅漫琪, 王小慧, 等. 1985-2018年中国甘蔗生产时空变化及区域优势分析[J]. 全国农业大学学报, 2022, 27(6): 120-131. |
| ZOU Xiaoman, FU Mancli, WANG Xiaohui, et al. Spatio-temporal changes and regional advantage analysis of sugarcane production in China from 1985 to 2018[J]. Journal of China Agricultural University, 2022, 27(6): 120-131. | |
| [3] | 杨万江, 陈文佳. 中国水稻生产空间布局变迁及影响因素分析[J]. 经济地理, 2011, 31(12): 2086-2093. |
| YANG Wanjiang, CHEN Wenjia. Studies on the spatial distribution changing of china’s rice production and its influencing factors[J]. Economic Geography, 2011, 31(12): 2086-2093. | |
| [4] |
刘杰安, 王小慧, 吴尧, 等. 近30年全国棉花生产时空变化与区域优势研究[J]. 中国农业科学, 2019, 52(11): 1883-1894.
DOI |
|
LIU Jiean, WANG Xiaohui, WU Yao, et al. Spatiotemporal Variation and Regional Advantages of Foxtail Millet Production in Recent 30 Years in China[J]. Scientia Agricultura Sinica, 2019, 52(11): 1883-1894.
DOI |
|
| [5] | 方超. 中国马铃薯生产空间布局变迁及影响因素分析[D]. 合肥: 安徽农业大学. |
| FANG Chao. Analysis on the spatial distribution transition of China's potato production and its influencinb factors[D]. Hefei: Anhui Agricultural University, 2017. | |
| [6] | 黄滋康, 崔读昌. 中国棉花生态区划[J]. 棉花学报, 2002, 14(3): 185-190. |
| HUANG Zikang, CUI Duchang. Ecological regionalization of cotton production in China[J]. Cotton Science, 2002, 14(3): 185-190. | |
| [7] | 刘东, 封志明, 杨艳昭, 等. 中国粮食生产发展特征及土地资源承载力空间格局现状[J]. 农业工程学报, 2011, 27(7): 1-6. |
| LIU Dong, FENG Zhiming, YANG Yanzhao, et al. Characteristics of grain production and spatial pattern of land carrying capacity of China[J]. Transactions of the Chinese Society of Agriculture Engineering, 2011, 27(7): 1-6. | |
| [8] | 吴海中, 田晓四, 陈保平. 安徽省粮食产量时空格局变化及安全评价[J]. 东北农业科学, 2021, 46(6): 109-113. |
| WU Haizhong, TIAN Xiaosi, CHEN Baoping. Spatio-temporal pattern change and safety evaluation of grain yield in Anhui province[J]. Journal of Northeast Agricultural Sciences, 2021, 46(6): 109-113. | |
| [9] |
卢秀茹, 贾肖月, 牛佳慧. 全国棉花产业发展现状及展望[J]. 中国农业科学, 2018, 51(1): 26-36.
DOI |
| LU Xiuru, JIA Xiaoyue, NIU Jiahui. The present situation and prospects of cotton industry development in Scientia Agricultura Sinica, 2018, 51(1): 26-36. | |
| [10] | 刘琰琰, 潘学标. 中国棉花生产县域比较优势分析[J]. 棉花学报, 2007, 19(1): 64-68. |
| LIU Yanyan, PAN Xuebiao. Study of comparative advantage of cotton producting counties in China[J]. Cotton Science, 2007, 19(1): 64-68. | |
| [11] |
马春玥, 买买提·沙吾提, 姚杰, 等. 1950-2015年中国棉花生产时空动态变化[J]. 地理学报, 2020, 75(8):1699-1710.
DOI |
|
MA Chunyue, Sawut Maimaiti, YAO Jie, et al. Spatio-temporal changes of cotton produc tion in China from 1950 to 2015[J]. Acta Geographica Sinica, 2020, 75(8): 1699-1710.
DOI |
|
| [12] |
徐培秀, 梅方权, 唐志发. 中国棉花区划研究[J]. 地理研究, 1983, 2(1): 12-22.
DOI |
|
XU Peixiu, MEI Fangquan, TANG Zhifa. A study of regionalization of cotton cultivation in China[J]. Geographical Research, 1983, 2(1): 12-22.
DOI |
|
| [13] | 朱启荣, 田新建, 张旭青. 基于比较利益的全国棉花种植空间布局变化的成因分析——对湖北、山东和新疆三省(区)的实证分析[J]. 农业现代化研究, 2004, 25(5): 340-343. |
| ZHU Qirong, TIAN Xinjian, ZHAN G Xuqing. Analysis on spatial variation of china's cotton production from point of relative advantage[J]. Research of Agricultural Modernization, 2004, 25(5): 340-343. | |
| [14] | 何叔军, 李育强, 肖才升, 等. 湖南棉花生产分析与展望[J]. 农学学报, 2014, 4(8): 16-21. |
|
HE Shujun, LI Yuqiang, XIAO Caisheng, et al. Cotton production analysis and prospect of hunan[J]. Journal of Agriculture, 2014, 4(8): 16-21.
DOI |
|
| [15] | 张海清, 吴敬学, 王子军. 中国国棉花主产省区布局变化及其原因的实证分析——基于1990-2004年数据[J]. 农业现代化研究, 2007, 28(1): 93-95. |
| ZHANG Haiqing, WU Jingxue, WANG Zijun. Empirical analysis of evolution of major cotton-growing provinces and its reasons in China[J]. Research of Agricultural Modernization, 2007, 28(1): 93-95. | |
| [16] |
YE Qing, YANG Xiaoguang, DAI Shuwei, et al. Effects of climate change on suitable rice cropping areas systems and crop water requirements in southern China[J]. Agricultural Water Management, 2015, 159: 35-44.
DOI URL |
| [17] |
Li J, Seto K. C., Bai J F. Urban economic development, changes in food consumption patterns requirements for food production in China[J]. China Agricultural Economic Review, 2015, 7(2): 240-261.
DOI URL |
| [18] | 王如意, 宋玉兰. 产业链视角下全国棉花生产布局演化及影响因素研究[J]. 资源开发与市场, 2022, 38(3): 337-343+384. |
| WANG Ruyi, SONG Yulan. Research on the evolution and influencing factors of China's cotton production layout from the perspective of industrial chain[J]. Resource Development & Market, 2020, 38(3): 337-343+384. | |
| [19] | 高升, 邓峰. 目标价格政策对我国棉花生产效率影响评价研究——基于DEA-Malmquist指数模型和变系数模型[J]. 价格理论与实践, 2019, (9): 54-57. |
| GAO Sheng, DENG Feng. Study on the impact of target price policy on cotton production efficiency in China--Based on DEA-malmqnist and variable coefficient model[J]. Price Theory and Practice, 2019(9): 54-57. | |
| [20] | 麦丹别克·安尼瓦尔, 热甫克提·阿布来提, 马腾, 等. 新疆2021年棉花生产剖析及未来种业发展方向[J]. 棉花科学, 2022, 44(1) : 11-14. |
| Maidanbek Aiuvar, Rapkat Ablat, MA Teng, et al. Analysis of cotton production and future development direction of seed industry in Xinjiang in 2021[J]. Cotton Sciences, 2022, 44(1) : 11-14. |
| [1] | 陈茂光, 林涛, 张昊, 刘海军, 王一帆, 汤秋香. 地膜类型对棉花生长的影响及自身降解和回收特性分析[J]. 新疆农业科学, 2023, 60(9): 2101-2108. |
| [2] | 杨川, 张凯, 陈冰, 张慧, 柳萍, 常松, 盛建东. 棉花植株形态特征对不同水分状况的响应[J]. 新疆农业科学, 2023, 60(9): 2120-2127. |
| [3] | 杨国江, 陈云, 林祥群, 何江勇, 刘盛林, 曲永清. 氮肥减施下有机肥替代对滴灌棉花产量、氮素吸收利用及土壤硝态氮的影响[J]. 新疆农业科学, 2023, 60(9): 2138-2145. |
| [4] | 李雪玲, 郭俊先, 陈莉, 宋鹤岭, 张众. 不同覆膜宽度对棉花农田环境的影响[J]. 新疆农业科学, 2023, 60(8): 1840-1847. |
| [5] | 阳妮, 玛依拉·玉素音, 杨延龙, 李春平, 张大伟, 徐海江, 赖成霞. 黄萎病枯斑型与黄化型病症棉花叶片的植物挥发物对比[J]. 新疆农业科学, 2023, 60(8): 1975-1986. |
| [6] | 米尔扎提·木塔力甫, 石秀楠, 柏军兵, 祖拜代·阿布都克日木, 吾勒加勒哈斯·阿扎提, 石书兵. 不同脱绒方式及PEG胁迫下对棉花种子活力及幼苗性状的影响[J]. 新疆农业科学, 2023, 60(7): 1561-1568. |
| [7] | 江柱, 张江辉, 白云岗, 杨鹏年, 刘洪波, 肖军, 刘旭辉. 膜下咸水滴灌水肥盐调控对棉花生长及产量的影响[J]. 新疆农业科学, 2023, 60(6): 1389-1397. |
| [8] | 王文涛, 吴博, 邰红忠, 练文明, 戴翠荣, 李双江, 蒲艳梅. 新疆阿拉尔垦区不同播期对棉花生长的影响[J]. 新疆农业科学, 2023, 60(6): 1413-1422. |
| [9] | 桑志伟, 梁亚军, 龚照龙, 郑巨云, 王俊铎, 李雪源, 陈全家. 不同陆地棉种质资源机采性状分析[J]. 新疆农业科学, 2023, 60(5): 1088-1098. |
| [10] | 逯涛, 曾庆涛, 张文, 王文博, 王政洋, 杨芮, 孙玉岩. 主成分分析及灰色关联度分析综合评价棉花产量与品质[J]. 新疆农业科学, 2023, 60(5): 1099-1109. |
| [11] | 王宁, 史应武, 牛新湘, 杨红梅, 楚敏, 詹发强, 包慧芳, 杨蓉, 龙宣杞, 丁荣荣. 棉花根际溶磷菌WJP-7发酵培养基优化及防病增产效果[J]. 新疆农业科学, 2023, 60(5): 1263-1270. |
| [12] | 代健敏, 张巨松, 徐新龙, 李始鑫, 翟梦华, 孙明辉. 氮肥运筹对雹后重播受旱棉花生长特性及产量影响[J]. 新疆农业科学, 2023, 60(4): 798-809. |
| [13] | 丁宇, 张江辉, 白云岗, 刘洪波, 郑明, 赵经华, 肖军, 韩政宇. 双膜条件下不同干播湿出水分处理对棉花生理、生长特性的影响[J]. 新疆农业科学, 2023, 60(4): 810-822. |
| [14] | 张宸, 梁悦, 殷昊, 张应榕, 陈波浪. 氮肥形态和品种对棉花根系形态与氮素积累的影响[J]. 新疆农业科学, 2023, 60(4): 823-831. |
| [15] | 程利华, 杨红兰, 马清倩, 史莹, 张大伟, Alisher A. Abdullaev, 张道远. 陆地棉种质黄萎病抗性生理鉴定分析[J]. 新疆农业科学, 2023, 60(4): 992-1002. |
| 阅读次数 | ||||||
|
全文 |
|
|||||
|
摘要 |
|
|||||