
新疆农业科学 ›› 2023, Vol. 60 ›› Issue (3): 766-780.DOI: 10.6048/j.issn.1001-4330.2023.03.029
• 草业·农业经济 • 上一篇
张泓1( ), 吐尔逊江·买买提2, 张少民1, 张军高1, 周小云1()
收稿日期:2022-07-30
出版日期:2023-03-20
发布日期:2023-04-18
通信作者:
周小云(1977-),男,重庆人,研究员,博士,研究方向为作物化控与生物技术,(E-mail)xiaoyunzhou77@126.com
作者简介:张泓(1969-),女,新疆乌鲁木齐人,经济师,研究方向为农业经济管理,(E-mail)952771731@qq.com
基金资助:
ZHANG Hong1(), Turxunjiang·Maimaiti2, Zhang Shaomin1, ZHANG Jungao1, ZHOU Xiaoyun1()
Received:2022-07-30
Online:2023-03-20
Published:2023-04-18
Correspondence author:
ZHOU Xiaoyun (1977 -), male, from Chongqing, researcher, doctor, research direction: crop chemical control and biotechnology, (E-mail)Supported by:摘要:
【目的】研究新疆棉花生产时空格局变化,分析棉花生产时空变化特征及其影响因素。【方法】选定新疆棉区为研究对象,基于1991~2020年新疆棉花生产的面板数据,以新疆区域及主要产棉市(县)为研究基本单元,采用时间序列与空间相结合,综合运用统计方法分析棉花种植面积、总产量、单产变化,研究新疆棉花生产的时空和区域特征以及各因素对新疆棉花生产的影响。【结果】(1)1990年以来新疆棉花种植面积和总产量年际变化相似,呈现2个阶段:波动中递增时期(1993~2010年),跳跃式增长时期(2010~2020年),期间北疆和南疆棉区持续增加而东疆棉区有所下降趋势,空间上呈现“东减南增北平稳”趋势。(2)近30年新疆棉花单产显著增加,由0.81×10³ kg/hm2增加到2020年1.85×103 kg/hm2,较同期增加近1.28倍,平均每年增产34.66 kg/hm2,增长速度较快。(3)全疆棉花总产量变化总体上以面积贡献为主,其次单位面积,互作主导为最低,新疆棉花的生产优势产域为南疆。【结论】30年来新疆棉花种植面积持续增加,生产集中程度不断增大,优势产区趋于稳定,单产逐步提升;棉花生产重心呈现出由喀什地区向阿克苏地区转移。
中图分类号:
张泓, 吐尔逊江·买买提, 张少民, 张军高, 周小云. 新疆棉花生产时空格局演变特征分析[J]. 新疆农业科学, 2023, 60(3): 766-780.
ZHANG Hong, Turxunjiang·Maimaiti, Zhang Shaomin, ZHANG Jungao, ZHOU Xiaoyun. Analysis on the Spatial and Temporal Pattern of Cotton Production in Xinjiang and its Influencing Factors[J]. Xinjiang Agricultural Sciences, 2023, 60(3): 766-780.
| 项目Item | 期初值 Initial value | 期末值 Final value | 增长率区间 Growth rate interval(%) | 平均增长率 Average growth rate(%) | 最大增长率Maximum growth rate | 最小增长率Minimum growth rate | |||
|---|---|---|---|---|---|---|---|---|---|
| (%) | 年份Year | (%) | 年份Year | ||||||
| 种植面积 Sown area (104 hm2) | 全疆 | 5.02 | 16.37 | -24.96~52.30 | 4.98 | 52.30 | 2014 | -24.96 | 2002 |
| 南疆 | 4.45 | 14.73 | 91.14~85.36 | 88.39 | 85.36 | 2014 | 91.14 | 2002 | |
| 北疆 | 0.28 | 1.43 | -17.86~87.50 | 7.16 | 87.50 | 1992 | -17.86 | 2014 | |
| 东疆 | 0.29 | 0.21 | -58.33~80.00 | 2.11 | 80.00 | 2003 | -58.33 | 2002 | |
| 总产量 Yield(108 kg) | 全疆 | 4.06 | 30.27 | -14.54~36.91 | 7.99 | 36.91 | 1994 | -14.54 | 2002 |
| 南疆 | 3.59 | 27.28 | 90.47~0.00 | 84.78 | 0.00 | 2018 | 90.47 | 2002 | |
| 北疆 | 0.24 | 2.63 | -23.4~47.80 | 10.00 | 47.80 | 2014 | -23.40 | 1996 | |
| 东疆 | 0.23 | 0.36 | -56.25~71.43 | 4.83 | 71.43 | 2003 | -56.25 | 2002 | |
| 单产 Unit output (103 kg/hm2) | 全疆 | 0.81 | 1.85 | -13.28~28.4 | 3.37 | 28.4 | 1992 | -13.28 | 1996 |
| 南疆 | 1.39 | 1.63 | 0.62~-4.79 | -0.72 | -4.79 | 2011 | 0.62 | 2014 | |
| 北疆 | 0.86 | 1.84 | -25.85~36.05 | 3.39 | 36.05 | 1992 | -25.85 | 1996 | |
| 东疆 | 0.79 | 1.71 | -22.86~44.30 | 3.30 | 44.30 | 1992 | -22.86 | 1996 | |
表1 1991~2020年新疆棉花生产基本数据比较
Tab.1 Comparison of basic data of cotton production in Xinjiang oasis in recent 30 years (1991-2020)
| 项目Item | 期初值 Initial value | 期末值 Final value | 增长率区间 Growth rate interval(%) | 平均增长率 Average growth rate(%) | 最大增长率Maximum growth rate | 最小增长率Minimum growth rate | |||
|---|---|---|---|---|---|---|---|---|---|
| (%) | 年份Year | (%) | 年份Year | ||||||
| 种植面积 Sown area (104 hm2) | 全疆 | 5.02 | 16.37 | -24.96~52.30 | 4.98 | 52.30 | 2014 | -24.96 | 2002 |
| 南疆 | 4.45 | 14.73 | 91.14~85.36 | 88.39 | 85.36 | 2014 | 91.14 | 2002 | |
| 北疆 | 0.28 | 1.43 | -17.86~87.50 | 7.16 | 87.50 | 1992 | -17.86 | 2014 | |
| 东疆 | 0.29 | 0.21 | -58.33~80.00 | 2.11 | 80.00 | 2003 | -58.33 | 2002 | |
| 总产量 Yield(108 kg) | 全疆 | 4.06 | 30.27 | -14.54~36.91 | 7.99 | 36.91 | 1994 | -14.54 | 2002 |
| 南疆 | 3.59 | 27.28 | 90.47~0.00 | 84.78 | 0.00 | 2018 | 90.47 | 2002 | |
| 北疆 | 0.24 | 2.63 | -23.4~47.80 | 10.00 | 47.80 | 2014 | -23.40 | 1996 | |
| 东疆 | 0.23 | 0.36 | -56.25~71.43 | 4.83 | 71.43 | 2003 | -56.25 | 2002 | |
| 单产 Unit output (103 kg/hm2) | 全疆 | 0.81 | 1.85 | -13.28~28.4 | 3.37 | 28.4 | 1992 | -13.28 | 1996 |
| 南疆 | 1.39 | 1.63 | 0.62~-4.79 | -0.72 | -4.79 | 2011 | 0.62 | 2014 | |
| 北疆 | 0.86 | 1.84 | -25.85~36.05 | 3.39 | 36.05 | 1992 | -25.85 | 1996 | |
| 东疆 | 0.79 | 1.71 | -22.86~44.30 | 3.30 | 44.30 | 1992 | -22.86 | 1996 | |

图1 1991~2020年新疆棉花生产数据的比较
Fig.1 Comparison of cotton production data in Xinjiang oasis in recent 30 years (1991-2020)
| 区域 Region | 时间段 Time interval | 面积变化量 Change in sown area (105 hm2) | 总产量变化量 Change in total production (108 kg) | 单产变化量 Change in yield (103 kg/hm2) | 面积贡献率 Area contribution rate (%) | 单产贡献率 Yield contribution rate(%) | 面积单产共同作用贡献率 Combined effect of area and yield contribution rate(%) |
|---|---|---|---|---|---|---|---|
| 全疆 The whole Xinjiang | 1991~1995 | -0.25 | 2.06 | 0.47 | 7.56 | 88.06 | 4.39 |
| 1996~2000 | 0.87 | 3.01 | 0.34 | 32.06 | 58.12 | 9.82 | |
| 2001~2005 | 0.09 | 1.96 | 0.27 | 6.50 | 92.28 | 1.23 | |
| 2006~2010 | 1.48 | 2.05 | -0.05 | 84.39 | 13.17 | 2.44 | |
| 2011~2015 | 5.41 | 12.28 | 0.26 | 64.89 | 23.56 | 11.56 | |
| 2016~2020 | 1.11 | 2.92 | 0.06 | 66.92 | 30.84 | 2.24 | |
| 南疆 Southern Xinjiang | 1991~1995 | -0.04 | 0.12 | 0.61 | 13.57 | 75.96 | 10.48 |
| 1996~2000 | -0.06 | -0.04 | 0.12 | 62.79 | 30.23 | 6.98 | |
| 2001~2005 | # | 0.03 | 0.13 | # | 100.00 | # | |
| 2006~2010 | 0.05 | 0.04 | -0.11 | 67.02 | 28.13 | 4.85 | |
| 2011~2015 | 0.14 | 0.27 | 0.11 | 79.35 | 14.98 | 5.67 | |
| 2016~2020 | -0.18 | -0.33 | -0.06 | 90.31 | 6.63 | 3.06 | |
| 北疆 North Xinjiang | 1991~1995 | 0.04 | 0.23 | 0.61 | 14.98 | 74.39 | 10.63 |
| 1996~2000 | 0.06 | 0.28 | 0.55 | 23.37 | 64.84 | 11.79 | |
| 2001~2005 | 0.15 | 0.25 | -0.04 | 92.67 | 5.30 | 2.04 | |
| 2006~2010 | 0.31 | 0.71 | 0.15 | 80.35 | 13.10 | 6.55 | |
| 2011~2015 | 0.66 | 1.05 | -0.18 | 81.82 | 10.99 | 7.18 | |
| 2016~2020 | -0.24 | -0.49 | -0.03 | 88.68 | 9.90 | 1.42 | |
| 东疆 East Xinjiang | 1991~1995 | -0.25 | 1.71 | 0.45 | 8.74 | 86.41 | 4.85 |
| 1996~2000 | 0.87 | 2.77 | 0.33 | 35.02 | 54.57 | 10.41 | |
| 2001~2005 | -0.06 | 1.68 | 0.29 | 4.49 | 94.58 | 0.92 | |
| 2006~2010 | 1.12 | 1.30 | -0.08 | 74.71 | 21.84 | 3.45 | |
| 2011~2015 | 4.61 | 10.96 | 0.32 | 58.41 | 28.15 | 13.45 | |
| 2016~2020 | 1.53 | 3.74 | 0.07 | 72.54 | 24.61 | 2.85 |
表2 1991~2020年各时段全疆棉花总产量贡献率变化
Tab.2 The change of cotton yield contribution rate in each period of China in recent 30 years(1991-2020)
| 区域 Region | 时间段 Time interval | 面积变化量 Change in sown area (105 hm2) | 总产量变化量 Change in total production (108 kg) | 单产变化量 Change in yield (103 kg/hm2) | 面积贡献率 Area contribution rate (%) | 单产贡献率 Yield contribution rate(%) | 面积单产共同作用贡献率 Combined effect of area and yield contribution rate(%) |
|---|---|---|---|---|---|---|---|
| 全疆 The whole Xinjiang | 1991~1995 | -0.25 | 2.06 | 0.47 | 7.56 | 88.06 | 4.39 |
| 1996~2000 | 0.87 | 3.01 | 0.34 | 32.06 | 58.12 | 9.82 | |
| 2001~2005 | 0.09 | 1.96 | 0.27 | 6.50 | 92.28 | 1.23 | |
| 2006~2010 | 1.48 | 2.05 | -0.05 | 84.39 | 13.17 | 2.44 | |
| 2011~2015 | 5.41 | 12.28 | 0.26 | 64.89 | 23.56 | 11.56 | |
| 2016~2020 | 1.11 | 2.92 | 0.06 | 66.92 | 30.84 | 2.24 | |
| 南疆 Southern Xinjiang | 1991~1995 | -0.04 | 0.12 | 0.61 | 13.57 | 75.96 | 10.48 |
| 1996~2000 | -0.06 | -0.04 | 0.12 | 62.79 | 30.23 | 6.98 | |
| 2001~2005 | # | 0.03 | 0.13 | # | 100.00 | # | |
| 2006~2010 | 0.05 | 0.04 | -0.11 | 67.02 | 28.13 | 4.85 | |
| 2011~2015 | 0.14 | 0.27 | 0.11 | 79.35 | 14.98 | 5.67 | |
| 2016~2020 | -0.18 | -0.33 | -0.06 | 90.31 | 6.63 | 3.06 | |
| 北疆 North Xinjiang | 1991~1995 | 0.04 | 0.23 | 0.61 | 14.98 | 74.39 | 10.63 |
| 1996~2000 | 0.06 | 0.28 | 0.55 | 23.37 | 64.84 | 11.79 | |
| 2001~2005 | 0.15 | 0.25 | -0.04 | 92.67 | 5.30 | 2.04 | |
| 2006~2010 | 0.31 | 0.71 | 0.15 | 80.35 | 13.10 | 6.55 | |
| 2011~2015 | 0.66 | 1.05 | -0.18 | 81.82 | 10.99 | 7.18 | |
| 2016~2020 | -0.24 | -0.49 | -0.03 | 88.68 | 9.90 | 1.42 | |
| 东疆 East Xinjiang | 1991~1995 | -0.25 | 1.71 | 0.45 | 8.74 | 86.41 | 4.85 |
| 1996~2000 | 0.87 | 2.77 | 0.33 | 35.02 | 54.57 | 10.41 | |
| 2001~2005 | -0.06 | 1.68 | 0.29 | 4.49 | 94.58 | 0.92 | |
| 2006~2010 | 1.12 | 1.30 | -0.08 | 74.71 | 21.84 | 3.45 | |
| 2011~2015 | 4.61 | 10.96 | 0.32 | 58.41 | 28.15 | 13.45 | |
| 2016~2020 | 1.53 | 3.74 | 0.07 | 72.54 | 24.61 | 2.85 |
| 棉区 Cotton area | 市(县) City (county) | 1991 | 2000 | |||||||||||
|---|---|---|---|---|---|---|---|---|---|---|---|---|---|---|
| 种植面积 Sown area (104 hm2) | 占总面积 Percentage of total area (%) | 总产量 Yield (108kg) | 占总产量 Percentage of yield (%) | 单产 Unit output (103 kg/hm2) | 较平均单 产增产 Increase in Unit output compared with the average(%) | 种植面积 Sown area (104 hm2) | 占总面积 Percentage of total area (%) | 总产量 Yield (108kg) | 占总产量 Percentage of Yield (%) | 单产 Unit output (103 kg/hm2) | 较平均 单产增产 Increase in Unit output compared with the average(%) | |||
| 南疆 Southern Xinjiang | 库尔勒市 | 0.09 | 1.79 | 0.07 | 1.72 | 0.80 | -1.23 | 0.17 | 2.82 | 0.25 | 2.87 | 1.47 | 1.38 | |
| 轮台县 | 0.04 | 0.80 | 0.02 | 0.49 | 0.53 | -34.57 | 0.09 | 1.50 | 0.13 | 1.49 | 1.52 | 4.83 | ||
| 尉犁县 | 0.04 | 0.80 | 0.03 | 0.74 | 0.85 | 4.94 | 0.18 | 2.99 | 0.28 | 3.21 | 1.56 | 7.59 | ||
| 若羌县 | 0.01 | 0.20 | 0.01 | 0.25 | 1.05 | 29.63 | 0.01 | 0.17 | 0.02 | 0.23 | 1.64 | 13.10 | ||
| 且末县 | 0.02 | 0.40 | 0.01 | 0.25 | 0.65 | -19.75 | 0.05 | 0.83 | 0.07 | 0.80 | 1.46 | 0.69 | ||
| 和硕县 | # | # | # | # | 0.54 | -33.33 | 0.05 | 0.83 | 0.06 | 0.69 | 1.29 | -11.03 | ||
| 博湖县 | # | # | # | # | 0.75 | -7.41 | 0.01 | 0.17 | # | # | 0.77 | -46.9 | ||
| 阿克苏市 | 0.16 | 3.19 | 0.15 | 3.69 | 0.91 | 12.35 | 0.21 | 3.49 | 0.37 | 4.24 | 1.77 | 22.07 | ||
| 温宿县 | 0.11 | 2.19 | 0.06 | 1.48 | 0.59 | -27.16 | 0.21 | 3.49 | 0.35 | 4.01 | 1.65 | 13.79 | ||
| 库车县 | 0.26 | 5.18 | 0.19 | 4.68 | 0.73 | -9.88 | 0.25 | 4.15 | 0.39 | 4.47 | 1.55 | 6.90 | ||
| 沙雅县 | 0.21 | 4.18 | 0.18 | 4.43 | 0.88 | 8.64 | 0.27 | 4.49 | 0.45 | 5.16 | 1.67 | 15.17 | ||
| 新和县 | 0.12 | 2.39 | 0.08 | 1.97 | 0.69 | -14.81 | 0.15 | 2.49 | 0.22 | 2.52 | 1.46 | 0.69 | ||
| 阿瓦提县 | 0.21 | 4.18 | 0.17 | 4.19 | 0.80 | -1.23 | 0.30 | 4.98 | 0.45 | 5.16 | 1.52 | 4.83 | ||
| 柯坪县 | 0.01 | 0.20 | # | # | 0.77 | -4.94 | 0.01 | 0.17 | 0.01 | 0.11 | 1.37 | -5.52 | ||
| 阿图什市 | 0.02 | 0.40 | 0.02 | 0.49 | 0.78 | -3.70 | 0.01 | 0.17 | 0.01 | 0.11 | 1.32 | -8.97 | ||
| 阿克陶县 | 0.05 | 1.00 | 0.03 | 0.74 | 0.64 | -20.99 | 0.04 | 0.66 | 0.04 | 0.46 | 0.99 | -31.72 | ||
| 喀什市 | # | # | # | # | 0.80 | -1.23 | # | # | # | # | 1.55 | 6.90 | ||
| 疏附县 | 0.16 | 3.19 | 0.14 | 3.45 | 0.87 | 7.41 | 0.10 | 1.66 | 0.13 | 1.49 | 1.35 | -6.90 | ||
| 疏勒县 | 0.20 | 3.98 | 0.15 | 3.69 | 0.76 | -6.17 | 0.19 | 3.16 | 0.23 | 2.64 | 1.22 | -15.86 | ||
| 英吉沙县 | 0.10 | 1.99 | 0.08 | 1.97 | 0.77 | -4.94 | 0.07 | 1.16 | 0.08 | 0.92 | 1.04 | -28.28 | ||
| 泽普县 | 0.15 | 2.99 | 0.13 | 3.20 | 0.86 | 6.17 | 0.13 | 2.16 | 0.21 | 2.41 | 1.58 | 8.97 | ||
| 莎车县 | 0.43 | 8.57 | 0.35 | 8.62 | 0.83 | 2.47 | 0.43 | 7.14 | 0.60 | 6.88 | 1.41 | -2.76 | ||
| 叶城县 | 0.22 | 4.38 | 0.15 | 3.69 | 0.70 | -13.58 | 0.16 | 2.66 | 0.21 | 2.41 | 1.32 | -8.97 | ||
| 麦盖提县 | 0.22 | 4.38 | 0.25 | 6.16 | 1.14 | 40.74 | 0.24 | 3.99 | 0.33 | 3.78 | 1.34 | -7.59 | ||
| 岳普湖县 | 0.09 | 1.79 | 0.11 | 2.71 | 1.23 | 51.85 | 0.11 | 1.83 | 0.15 | 1.72 | 1.37 | -5.52 | ||
| 伽师县 | 0.16 | 3.19 | 0.16 | 3.94 | 1.03 | 27.16 | 0.21 | 3.49 | 0.25 | 2.87 | 1.17 | -19.31 | ||
| 巴楚县 | 0.32 | 6.37 | 0.29 | 7.14 | 0.91 | 12.35 | 0.31 | 5.15 | 0.38 | 4.36 | 1.25 | -13.79 | ||
| 和田县 | 0.06 | 1.20 | 0.05 | 1.23 | 0.86 | 6.17 | 0.06 | 1.00 | 0.06 | 0.69 | 0.95 | -34.48 | ||
| 墨玉县 | 0.13 | 2.59 | 0.09 | 2.22 | 0.65 | -19.75 | 0.08 | 1.33 | 0.06 | 0.69 | 0.71 | -51.03 | ||
| 皮山县 | 0.07 | 1.39 | 0.05 | 1.23 | 0.66 | -18.52 | 0.04 | 0.66 | 0.05 | 0.57 | 1.05 | -27.59 | ||
| 策勒县 | 0.05 | 1.00 | 0.03 | 0.74 | 0.75 | -7.41 | 0.04 | 0.66 | 0.04 | 0.46 | 1.28 | -11.72 | ||
| 于田县 | 0.07 | 1.39 | 0.05 | 1.23 | 0.75 | -7.41 | 0.08 | 1.33 | 0.08 | 0.92 | 1.10 | -24.14 | ||
| 棉区 Cotton area | 市(县) City (county) | 2010 | 2020 | |||||||||||
| 种植面积 Sown area (104 hm2) | 占总面积 Percentage of total area (%) | 总产量 Yield (108kg) | 占总产量 Percentage of yield (%) | 单产 Unit output (103 kg/hm2) | 较平均 单产增产 Increase in Unit output compared with the average(%) | 种植面积 Sown area (104 hm2) | 占总面积 Percentage of total area (%) | 总产量 Yield (108kg) | 占总产量 Percentage of Yield (%) | 单产 Unit output (103 kg/hm2) | 较平均 单产增产 Increase in Unit output compared with the average(%) | |||
| 南疆 Southern Xinjiang | 库尔勒市 | 0.46 | 4.86 | 0.91 | 5.73 | 1.97 | 17.26 | 0.60 | 3.67 | 1.19 | 3.93 | 1.96 | 5.95 | |
| 轮台县 | 0.30 | 3.17 | 0.58 | 3.65 | 1.94 | 15.48 | 0.65 | 3.97 | 1.21 | 4.00 | 1.88 | 1.62 | ||
| 尉犁县 | 0.37 | 3.91 | 0.81 | 5.10 | 2.22 | 32.14 | 0.69 | 4.22 | 1.49 | 4.92 | 2.17 | 17.30 | ||
| 若羌县 | 0.03 | 0.32 | 0.05 | 0.31 | 1.78 | 5.95 | 0.03 | 0.18 | 0.05 | 0.17 | 1.80 | -2.70 | ||
| 且末县 | 0.11 | 1.16 | 0.22 | 1.38 | 2.00 | 19.05 | 0.09 | 0.55 | 0.15 | 0.50 | 1.65 | -10.81 | ||
| 和硕县 | 0.13 | 1.37 | 0.26 | 1.64 | 1.93 | 14.88 | 0.02 | 0.12 | 0.03 | 0.10 | 1.73 | -6.49 | ||
| 博湖县 | 0.05 | 0.53 | 0.09 | 0.57 | 1.70 | 1.19 | 0.04 | 0.24 | 0.08 | 0.26 | 1.83 | -1.08 | ||
| 阿克苏市 | 0.45 | 4.75 | 0.90 | 5.66 | 2.03 | 20.83 | 0.62 | 3.79 | 1.09 | 3.6 | 1.78 | -3.78 | ||
| 温宿县 | 0.37 | 3.91 | 0.52 | 3.27 | 1.43 | -14.88 | 0.34 | 2.08 | 0.63 | 2.08 | 1.86 | 0.54 | ||
| 库车县 | 0.50 | 5.28 | 0.69 | 4.34 | 1.39 | -17.26 | 1.16 | 7.09 | 2.15 | 7.10 | 1.86 | 0.54 | ||
| 沙雅县 | 0.57 | 6.02 | 0.89 | 5.60 | 1.56 | -7.14 | 1.34 | 8.19 | 2.54 | 8.39 | 1.90 | 2.70 | ||
| 新和县 | 0.33 | 3.48 | 0.54 | 3.40 | 1.62 | -3.57 | 0.56 | 3.42 | 1.02 | 3.37 | 1.84 | -0.54 | ||
| 阿瓦提县 | 0.67 | 7.07 | 0.83 | 5.22 | 1.25 | -25.60 | 0.96 | 5.86 | 1.75 | 5.78 | 1.83 | -1.08 | ||
| 柯坪县 | 0.05 | 0.53 | 0.09 | 0.57 | 1.73 | 2.98 | 0.08 | 0.49 | 0.16 | 0.53 | 1.98 | 7.03 | ||
| 阿图什市 | 0.02 | 0.21 | 0.03 | 0.19 | 1.49 | -11.31 | 0.06 | 0.37 | 0.12 | 0.40 | 1.90 | 2.70 | ||
| 阿克陶县 | 0.04 | 0.42 | 0.06 | 0.38 | 1.49 | -11.31 | 0.04 | 0.24 | 0.06 | 0.20 | 1.78 | -3.78 | ||
| 喀什市 | # | # | # | # | # | # | 0.15 | 0.92 | 0.23 | 0.76 | 1.56 | -15.68 | ||
| 疏附县 | 0.03 | 0.32 | 0.05 | 0.31 | 1.57 | -6.55 | 0.03 | 0.18 | 0.06 | 0.20 | 1.76 | -4.86 | ||
| 疏勒县 | 0.12 | 1.27 | 0.16 | 1.01 | 1.36 | -19.05 | 0.36 | 2.20 | 0.60 | 1.98 | 1.66 | -10.27 | ||
| 英吉沙县 | 0.07 | 0.74 | 0.09 | 0.57 | 1.39 | -17.26 | 0.15 | 0.92 | 0.27 | 0.89 | 1.77 | -4.32 | ||
| 泽普县 | 0.08 | 0.84 | 0.07 | 0.44 | 0.93 | -44.64 | 0.05 | 0.31 | 0.09 | 0.30 | 1.75 | -5.41 | ||
| 莎车县 | 0.43 | 4.54 | 0.53 | 3.34 | 1.22 | -27.38 | 0.47 | 2.87 | 0.77 | 2.54 | 1.66 | -10.27 | ||
| 叶城县 | 0.07 | 0.74 | 0.09 | 0.57 | 1.40 | -16.67 | 0.17 | 1.04 | 0.28 | 0.93 | 1.69 | -8.65 | ||
| 麦盖提县 | 0.37 | 3.91 | 0.71 | 4.47 | 1.92 | 14.29 | 0.36 | 2.20 | 0.67 | 2.21 | 1.84 | -0.54 | ||
| 岳普湖县 | 0.13 | 1.37 | 0.20 | 1.26 | 1.50 | -10.71 | 0.44 | 2.69 | 0.75 | 2.48 | 1.71 | -7.57 | ||
| 伽师县 | 0.17 | 1.80 | 0.27 | 1.70 | 1.62 | -3.57 | 0.82 | 5.01 | 1.42 | 4.69 | 1.73 | -6.49 | ||
| 巴楚县 | 0.51 | 5.39 | 0.95 | 5.98 | 1.88 | 11.90 | 0.68 | 4.15 | 1.21 | 4.00 | 1.77 | -4.32 | ||
| 和田县 | 0.03 | 0.32 | 0.05 | 0.31 | 1.92 | 14.29 | # | # | # | # | 1.00 | -45.95 | ||
| 墨玉县 | 0.04 | 0.42 | 0.08 | 0.50 | 1.90 | 13.10 | 0.01 | 0.06 | 0.01 | 0.03 | 1.28 | -30.81 | ||
| 皮山县 | 0.04 | 0.42 | 0.07 | 0.44 | 1.91 | 13.69 | 0.01 | 0.06 | 0.01 | 0.03 | 1.77 | -4.32 | ||
| 策勒县 | 0.03 | 0.32 | 0.06 | 0.38 | 1.89 | 12.50 | # | # | 0.01 | 0.03 | 1.85 | 0.00 | ||
| 于田县 | 0.07 | 0.74 | 0.12 | 0.76 | 1.80 | 7.14 | 0.01 | 0.06 | 0.01 | 0.03 | 1.74 | -5.95 | ||
| 棉区 Cotton area | 市(县) City (county) | 1991 | 2000 | |||||||||||
| 种植面积 Sown area (104 hm2) | 占总面积 Percentage of total area (%) | 总产量 Yield (108kg) | 占总产量 Percentage of yield (%) | 单产 Unit output (103 kg/hm2) | 较平均 单产增产 Increase in Unit output compared with the average(%) | 种植面积 Sown area (104 hm2) | 占总面积 Percentage of total area (%) | 总产量 Yield (108kg) | 占总产量 Percentage of Yield (%) | 单产 Unit output (103 kg/hm2) | 较平均 单产增产 Increase in Unit output compared with the average(%) | |||
| 北疆 North Xinjiang | 克拉玛依市 | # | # | # | # | 0.72 | -11.11 | 0.03 | 0.50 | 0.04 | 0.46 | 1.34 | -7.59 | |
| 昌吉市 | 0.01 | 0.20 | # | # | 0.72 | -11.11 | 0.10 | 1.66 | 0.13 | 1.49 | 1.28 | -11.72 | ||
| 博乐市 | 0.11 | 2.19 | 0.08 | 1.97 | 0.75 | -7.41 | 0.13 | 2.16 | 0.21 | 2.41 | 1.64 | 13.10 | ||
| 精河县 | 0.11 | 2.19 | 0.10 | 2.46 | 0.88 | 8.64 | 0.15 | 2.49 | 0.24 | 2.75 | 1.65 | 13.79 | ||
| 阜康市 | # | # | # | # | 0.40 | -50.62 | 0.02 | 0.33 | 0.02 | 0.23 | 1.22 | -15.86 | ||
| 呼图壁县 | 0.02 | 0.40 | 0.01 | 0.25 | 0.56 | -30.86 | 0.15 | 2.49 | 0.24 | 2.75 | 1.56 | 7.59 | ||
| 玛纳斯县 | 0.11 | 2.19 | 0.08 | 1.97 | 0.73 | -9.88 | 0.27 | 4.49 | 0.51 | 5.85 | 1.88 | 29.66 | ||
| 奎屯市 | # | # | # | # | # | # | # | # | # | # | 1.50 | 3.45 | ||
| 霍城县 | 0.02 | 0.40 | 0.01 | 0.25 | 0.56 | -30.86 | 0.02 | 0.33 | 0.02 | 0.23 | 1.13 | -22.07 | ||
| 乌苏市 | 0.18 | 3.59 | 0.13 | 3.20 | 0.71 | -12.35 | 0.27 | 4.49 | 0.45 | 5.16 | 1.64 | 13.10 | ||
| 沙湾县 | 0.24 | 4.78 | 0.18 | 4.43 | 0.73 | -9.88 | 0.26 | 4.32 | 0.43 | 4.93 | 1.65 | 13.79 | ||
| 和布克赛尔 蒙古自治县 | # | # | # | # | # | # | # | # | # | # | 1.41 | -2.76 | ||
| 察布查尔 锡伯自治县 | 0.01 | 0.20 | # | # | 0.47 | -41.98 | 0.01 | 0.17 | 0.01 | 0.11 | 0.86 | -40.69 | ||
| 东疆 East Xinjiang | 吐鲁番高昌区 | 0.10 | 1.99 | 0.07 | 1.72 | 0.75 | -7.41 | 0.05 | 0.83 | 0.06 | 0.69 | 1.16 | -20.00 | |
| 鄯善县 | 0.07 | 1.39 | 0.06 | 1.48 | 0.75 | -7.41 | 0.03 | 0.50 | 0.05 | 0.57 | 1.34 | -7.59 | ||
| 托克逊县 | 0.09 | 1.79 | 0.08 | 1.97 | 0.87 | 7.41 | 0.05 | 0.83 | 0.07 | 0.80 | 1.22 | -15.86 | ||
| 哈密伊州区 | 0.03 | 0.60 | 0.02 | 0.49 | 0.78 | -3.70 | 0.06 | 1.00 | 0.07 | 0.80 | 1.19 | -17.93 | ||
| 棉区 Cotton area | 市(县) City (county) | 2010 | 2020 | |||||||||||
| 种植面积 Sown area (104 hm2) | 占总面积 Percentage of total area (%) | 总产量 Yield (108kg) | 占总产量 Percentage of yield (%) | 单产 Unit output (103 kg/hm2) | 较平均 单产增产 Increase in Unit output compared with the average(%) | 种植面积 Sown area (104 hm2) | 占总面积 Percentage of total area (%) | 总产量 Yield (108kg) | 占总产量 Percentage of Yield (%) | 单产 Unit output (103 kg/hm2) | 较平均 单产增产 Increase in Unit output compared with the average(%) | |||
| 北疆 North Xinjiang | 克拉玛依市 | 0.07 | 0.74 | 0.11 | 0.69 | 1.53 | -8.93 | 0.13 | 0.79 | 0.25 | 0.83 | 1.88 | 1.62 | |
| 昌吉市 | 0.23 | 2.43 | 0.38 | 2.39 | 1.61 | -4.17 | 0.31 | 1.89 | 0.54 | 1.78 | 1.72 | -7.03 | ||
| 博乐市 | 0.17 | 1.80 | 0.37 | 2.33 | 2.13 | 26.79 | 0.31 | 1.89 | 0.59 | 1.95 | 1.92 | 3.78 | ||
| 精河县 | 0.27 | 2.85 | 0.58 | 3.65 | 2.14 | 27.38 | 0.64 | 3.91 | 1.24 | 4.10 | 1.94 | 4.86 | ||
| 阜康市 | # | # | # | # | 1.23 | -26.79 | 0.14 | 0.86 | 0.26 | 0.86 | 1.82 | -1.62 | ||
| 呼图壁县 | 0.25 | 2.64 | 0.43 | 2.71 | 1.70 | 1.19 | 0.53 | 3.24 | 1.15 | 3.80 | 2.15 | 16.22 | ||
| 玛纳斯县 | 0.28 | 2.96 | 0.58 | 3.65 | 2.04 | 21.43 | 0.56 | 3.42 | 1.11 | 3.67 | 2.00 | 8.11 | ||
| 奎屯市 | 0.02 | 0.21 | 0.01 | 0.06 | 0.90 | -46.43 | 0.12 | 0.73 | 0.23 | 0.76 | 1.98 | 7.03 | ||
| 霍城县 | 0.01 | 0.11 | 0.01 | 0.06 | 1.14 | -32.14 | # | # | # | # | 1.61 | -12.97 | ||
| 乌苏市 | # | # | # | # | # | # | 1.17 | 7.15 | 2.09 | 6.90 | 1.78 | -3.78 | ||
| 沙湾县 | 0.47 | 4.96 | 0.76 | 4.78 | 1.61 | -4.17 | 1.20 | 7.33 | 2.21 | 7.30 | 1.87 | 1.08 | ||
| 和布克赛尔 蒙古自治县 | 0.07 | 0.74 | 0.10 | 0.63 | 1.52 | -9.52 | 0.06 | 0.37 | 0.10 | 0.33 | 1.77 | -4.32 | ||
| 察布查尔 锡伯自治县 | 0.08 | 0.84 | 0.09 | 0.57 | 1.17 | -30.36 | # | # | # | # | 1.54 | -16.76 | ||
| 东疆 East Xinjiang | 吐鲁番高昌区 | 0.04 | 0.42 | 0.05 | 0.31 | 1.28 | -23.81 | # | # | # | # | 1.30 | -29.73 | |
| 鄯善县 | 0.06 | 0.63 | 0.08 | 0.50 | 1.37 | -18.45 | # | # | 0.01 | 0.03 | 1.50 | -18.92 | ||
| 托克逊县 | 0.09 | 0.95 | 0.11 | 0.69 | 1.13 | -32.74 | 0.05 | 0.31 | 0.07 | 0.23 | 1.47 | -20.54 | ||
| 哈密伊州区 | 0.15 | 1.58 | 0.24 | 1.51 | 1.64 | -2.38 | 0.15 | 0.92 | 0.28 | 0.93 | 1.86 | 0.54 | ||
表3 1991~2020年新疆各主产市(县)棉花生产数据的比较
Tab.3 Comparison of cotton production data of main producing cities(counties) in Xinjiang in 1991-2020
| 棉区 Cotton area | 市(县) City (county) | 1991 | 2000 | |||||||||||
|---|---|---|---|---|---|---|---|---|---|---|---|---|---|---|
| 种植面积 Sown area (104 hm2) | 占总面积 Percentage of total area (%) | 总产量 Yield (108kg) | 占总产量 Percentage of yield (%) | 单产 Unit output (103 kg/hm2) | 较平均单 产增产 Increase in Unit output compared with the average(%) | 种植面积 Sown area (104 hm2) | 占总面积 Percentage of total area (%) | 总产量 Yield (108kg) | 占总产量 Percentage of Yield (%) | 单产 Unit output (103 kg/hm2) | 较平均 单产增产 Increase in Unit output compared with the average(%) | |||
| 南疆 Southern Xinjiang | 库尔勒市 | 0.09 | 1.79 | 0.07 | 1.72 | 0.80 | -1.23 | 0.17 | 2.82 | 0.25 | 2.87 | 1.47 | 1.38 | |
| 轮台县 | 0.04 | 0.80 | 0.02 | 0.49 | 0.53 | -34.57 | 0.09 | 1.50 | 0.13 | 1.49 | 1.52 | 4.83 | ||
| 尉犁县 | 0.04 | 0.80 | 0.03 | 0.74 | 0.85 | 4.94 | 0.18 | 2.99 | 0.28 | 3.21 | 1.56 | 7.59 | ||
| 若羌县 | 0.01 | 0.20 | 0.01 | 0.25 | 1.05 | 29.63 | 0.01 | 0.17 | 0.02 | 0.23 | 1.64 | 13.10 | ||
| 且末县 | 0.02 | 0.40 | 0.01 | 0.25 | 0.65 | -19.75 | 0.05 | 0.83 | 0.07 | 0.80 | 1.46 | 0.69 | ||
| 和硕县 | # | # | # | # | 0.54 | -33.33 | 0.05 | 0.83 | 0.06 | 0.69 | 1.29 | -11.03 | ||
| 博湖县 | # | # | # | # | 0.75 | -7.41 | 0.01 | 0.17 | # | # | 0.77 | -46.9 | ||
| 阿克苏市 | 0.16 | 3.19 | 0.15 | 3.69 | 0.91 | 12.35 | 0.21 | 3.49 | 0.37 | 4.24 | 1.77 | 22.07 | ||
| 温宿县 | 0.11 | 2.19 | 0.06 | 1.48 | 0.59 | -27.16 | 0.21 | 3.49 | 0.35 | 4.01 | 1.65 | 13.79 | ||
| 库车县 | 0.26 | 5.18 | 0.19 | 4.68 | 0.73 | -9.88 | 0.25 | 4.15 | 0.39 | 4.47 | 1.55 | 6.90 | ||
| 沙雅县 | 0.21 | 4.18 | 0.18 | 4.43 | 0.88 | 8.64 | 0.27 | 4.49 | 0.45 | 5.16 | 1.67 | 15.17 | ||
| 新和县 | 0.12 | 2.39 | 0.08 | 1.97 | 0.69 | -14.81 | 0.15 | 2.49 | 0.22 | 2.52 | 1.46 | 0.69 | ||
| 阿瓦提县 | 0.21 | 4.18 | 0.17 | 4.19 | 0.80 | -1.23 | 0.30 | 4.98 | 0.45 | 5.16 | 1.52 | 4.83 | ||
| 柯坪县 | 0.01 | 0.20 | # | # | 0.77 | -4.94 | 0.01 | 0.17 | 0.01 | 0.11 | 1.37 | -5.52 | ||
| 阿图什市 | 0.02 | 0.40 | 0.02 | 0.49 | 0.78 | -3.70 | 0.01 | 0.17 | 0.01 | 0.11 | 1.32 | -8.97 | ||
| 阿克陶县 | 0.05 | 1.00 | 0.03 | 0.74 | 0.64 | -20.99 | 0.04 | 0.66 | 0.04 | 0.46 | 0.99 | -31.72 | ||
| 喀什市 | # | # | # | # | 0.80 | -1.23 | # | # | # | # | 1.55 | 6.90 | ||
| 疏附县 | 0.16 | 3.19 | 0.14 | 3.45 | 0.87 | 7.41 | 0.10 | 1.66 | 0.13 | 1.49 | 1.35 | -6.90 | ||
| 疏勒县 | 0.20 | 3.98 | 0.15 | 3.69 | 0.76 | -6.17 | 0.19 | 3.16 | 0.23 | 2.64 | 1.22 | -15.86 | ||
| 英吉沙县 | 0.10 | 1.99 | 0.08 | 1.97 | 0.77 | -4.94 | 0.07 | 1.16 | 0.08 | 0.92 | 1.04 | -28.28 | ||
| 泽普县 | 0.15 | 2.99 | 0.13 | 3.20 | 0.86 | 6.17 | 0.13 | 2.16 | 0.21 | 2.41 | 1.58 | 8.97 | ||
| 莎车县 | 0.43 | 8.57 | 0.35 | 8.62 | 0.83 | 2.47 | 0.43 | 7.14 | 0.60 | 6.88 | 1.41 | -2.76 | ||
| 叶城县 | 0.22 | 4.38 | 0.15 | 3.69 | 0.70 | -13.58 | 0.16 | 2.66 | 0.21 | 2.41 | 1.32 | -8.97 | ||
| 麦盖提县 | 0.22 | 4.38 | 0.25 | 6.16 | 1.14 | 40.74 | 0.24 | 3.99 | 0.33 | 3.78 | 1.34 | -7.59 | ||
| 岳普湖县 | 0.09 | 1.79 | 0.11 | 2.71 | 1.23 | 51.85 | 0.11 | 1.83 | 0.15 | 1.72 | 1.37 | -5.52 | ||
| 伽师县 | 0.16 | 3.19 | 0.16 | 3.94 | 1.03 | 27.16 | 0.21 | 3.49 | 0.25 | 2.87 | 1.17 | -19.31 | ||
| 巴楚县 | 0.32 | 6.37 | 0.29 | 7.14 | 0.91 | 12.35 | 0.31 | 5.15 | 0.38 | 4.36 | 1.25 | -13.79 | ||
| 和田县 | 0.06 | 1.20 | 0.05 | 1.23 | 0.86 | 6.17 | 0.06 | 1.00 | 0.06 | 0.69 | 0.95 | -34.48 | ||
| 墨玉县 | 0.13 | 2.59 | 0.09 | 2.22 | 0.65 | -19.75 | 0.08 | 1.33 | 0.06 | 0.69 | 0.71 | -51.03 | ||
| 皮山县 | 0.07 | 1.39 | 0.05 | 1.23 | 0.66 | -18.52 | 0.04 | 0.66 | 0.05 | 0.57 | 1.05 | -27.59 | ||
| 策勒县 | 0.05 | 1.00 | 0.03 | 0.74 | 0.75 | -7.41 | 0.04 | 0.66 | 0.04 | 0.46 | 1.28 | -11.72 | ||
| 于田县 | 0.07 | 1.39 | 0.05 | 1.23 | 0.75 | -7.41 | 0.08 | 1.33 | 0.08 | 0.92 | 1.10 | -24.14 | ||
| 棉区 Cotton area | 市(县) City (county) | 2010 | 2020 | |||||||||||
| 种植面积 Sown area (104 hm2) | 占总面积 Percentage of total area (%) | 总产量 Yield (108kg) | 占总产量 Percentage of yield (%) | 单产 Unit output (103 kg/hm2) | 较平均 单产增产 Increase in Unit output compared with the average(%) | 种植面积 Sown area (104 hm2) | 占总面积 Percentage of total area (%) | 总产量 Yield (108kg) | 占总产量 Percentage of Yield (%) | 单产 Unit output (103 kg/hm2) | 较平均 单产增产 Increase in Unit output compared with the average(%) | |||
| 南疆 Southern Xinjiang | 库尔勒市 | 0.46 | 4.86 | 0.91 | 5.73 | 1.97 | 17.26 | 0.60 | 3.67 | 1.19 | 3.93 | 1.96 | 5.95 | |
| 轮台县 | 0.30 | 3.17 | 0.58 | 3.65 | 1.94 | 15.48 | 0.65 | 3.97 | 1.21 | 4.00 | 1.88 | 1.62 | ||
| 尉犁县 | 0.37 | 3.91 | 0.81 | 5.10 | 2.22 | 32.14 | 0.69 | 4.22 | 1.49 | 4.92 | 2.17 | 17.30 | ||
| 若羌县 | 0.03 | 0.32 | 0.05 | 0.31 | 1.78 | 5.95 | 0.03 | 0.18 | 0.05 | 0.17 | 1.80 | -2.70 | ||
| 且末县 | 0.11 | 1.16 | 0.22 | 1.38 | 2.00 | 19.05 | 0.09 | 0.55 | 0.15 | 0.50 | 1.65 | -10.81 | ||
| 和硕县 | 0.13 | 1.37 | 0.26 | 1.64 | 1.93 | 14.88 | 0.02 | 0.12 | 0.03 | 0.10 | 1.73 | -6.49 | ||
| 博湖县 | 0.05 | 0.53 | 0.09 | 0.57 | 1.70 | 1.19 | 0.04 | 0.24 | 0.08 | 0.26 | 1.83 | -1.08 | ||
| 阿克苏市 | 0.45 | 4.75 | 0.90 | 5.66 | 2.03 | 20.83 | 0.62 | 3.79 | 1.09 | 3.6 | 1.78 | -3.78 | ||
| 温宿县 | 0.37 | 3.91 | 0.52 | 3.27 | 1.43 | -14.88 | 0.34 | 2.08 | 0.63 | 2.08 | 1.86 | 0.54 | ||
| 库车县 | 0.50 | 5.28 | 0.69 | 4.34 | 1.39 | -17.26 | 1.16 | 7.09 | 2.15 | 7.10 | 1.86 | 0.54 | ||
| 沙雅县 | 0.57 | 6.02 | 0.89 | 5.60 | 1.56 | -7.14 | 1.34 | 8.19 | 2.54 | 8.39 | 1.90 | 2.70 | ||
| 新和县 | 0.33 | 3.48 | 0.54 | 3.40 | 1.62 | -3.57 | 0.56 | 3.42 | 1.02 | 3.37 | 1.84 | -0.54 | ||
| 阿瓦提县 | 0.67 | 7.07 | 0.83 | 5.22 | 1.25 | -25.60 | 0.96 | 5.86 | 1.75 | 5.78 | 1.83 | -1.08 | ||
| 柯坪县 | 0.05 | 0.53 | 0.09 | 0.57 | 1.73 | 2.98 | 0.08 | 0.49 | 0.16 | 0.53 | 1.98 | 7.03 | ||
| 阿图什市 | 0.02 | 0.21 | 0.03 | 0.19 | 1.49 | -11.31 | 0.06 | 0.37 | 0.12 | 0.40 | 1.90 | 2.70 | ||
| 阿克陶县 | 0.04 | 0.42 | 0.06 | 0.38 | 1.49 | -11.31 | 0.04 | 0.24 | 0.06 | 0.20 | 1.78 | -3.78 | ||
| 喀什市 | # | # | # | # | # | # | 0.15 | 0.92 | 0.23 | 0.76 | 1.56 | -15.68 | ||
| 疏附县 | 0.03 | 0.32 | 0.05 | 0.31 | 1.57 | -6.55 | 0.03 | 0.18 | 0.06 | 0.20 | 1.76 | -4.86 | ||
| 疏勒县 | 0.12 | 1.27 | 0.16 | 1.01 | 1.36 | -19.05 | 0.36 | 2.20 | 0.60 | 1.98 | 1.66 | -10.27 | ||
| 英吉沙县 | 0.07 | 0.74 | 0.09 | 0.57 | 1.39 | -17.26 | 0.15 | 0.92 | 0.27 | 0.89 | 1.77 | -4.32 | ||
| 泽普县 | 0.08 | 0.84 | 0.07 | 0.44 | 0.93 | -44.64 | 0.05 | 0.31 | 0.09 | 0.30 | 1.75 | -5.41 | ||
| 莎车县 | 0.43 | 4.54 | 0.53 | 3.34 | 1.22 | -27.38 | 0.47 | 2.87 | 0.77 | 2.54 | 1.66 | -10.27 | ||
| 叶城县 | 0.07 | 0.74 | 0.09 | 0.57 | 1.40 | -16.67 | 0.17 | 1.04 | 0.28 | 0.93 | 1.69 | -8.65 | ||
| 麦盖提县 | 0.37 | 3.91 | 0.71 | 4.47 | 1.92 | 14.29 | 0.36 | 2.20 | 0.67 | 2.21 | 1.84 | -0.54 | ||
| 岳普湖县 | 0.13 | 1.37 | 0.20 | 1.26 | 1.50 | -10.71 | 0.44 | 2.69 | 0.75 | 2.48 | 1.71 | -7.57 | ||
| 伽师县 | 0.17 | 1.80 | 0.27 | 1.70 | 1.62 | -3.57 | 0.82 | 5.01 | 1.42 | 4.69 | 1.73 | -6.49 | ||
| 巴楚县 | 0.51 | 5.39 | 0.95 | 5.98 | 1.88 | 11.90 | 0.68 | 4.15 | 1.21 | 4.00 | 1.77 | -4.32 | ||
| 和田县 | 0.03 | 0.32 | 0.05 | 0.31 | 1.92 | 14.29 | # | # | # | # | 1.00 | -45.95 | ||
| 墨玉县 | 0.04 | 0.42 | 0.08 | 0.50 | 1.90 | 13.10 | 0.01 | 0.06 | 0.01 | 0.03 | 1.28 | -30.81 | ||
| 皮山县 | 0.04 | 0.42 | 0.07 | 0.44 | 1.91 | 13.69 | 0.01 | 0.06 | 0.01 | 0.03 | 1.77 | -4.32 | ||
| 策勒县 | 0.03 | 0.32 | 0.06 | 0.38 | 1.89 | 12.50 | # | # | 0.01 | 0.03 | 1.85 | 0.00 | ||
| 于田县 | 0.07 | 0.74 | 0.12 | 0.76 | 1.80 | 7.14 | 0.01 | 0.06 | 0.01 | 0.03 | 1.74 | -5.95 | ||
| 棉区 Cotton area | 市(县) City (county) | 1991 | 2000 | |||||||||||
| 种植面积 Sown area (104 hm2) | 占总面积 Percentage of total area (%) | 总产量 Yield (108kg) | 占总产量 Percentage of yield (%) | 单产 Unit output (103 kg/hm2) | 较平均 单产增产 Increase in Unit output compared with the average(%) | 种植面积 Sown area (104 hm2) | 占总面积 Percentage of total area (%) | 总产量 Yield (108kg) | 占总产量 Percentage of Yield (%) | 单产 Unit output (103 kg/hm2) | 较平均 单产增产 Increase in Unit output compared with the average(%) | |||
| 北疆 North Xinjiang | 克拉玛依市 | # | # | # | # | 0.72 | -11.11 | 0.03 | 0.50 | 0.04 | 0.46 | 1.34 | -7.59 | |
| 昌吉市 | 0.01 | 0.20 | # | # | 0.72 | -11.11 | 0.10 | 1.66 | 0.13 | 1.49 | 1.28 | -11.72 | ||
| 博乐市 | 0.11 | 2.19 | 0.08 | 1.97 | 0.75 | -7.41 | 0.13 | 2.16 | 0.21 | 2.41 | 1.64 | 13.10 | ||
| 精河县 | 0.11 | 2.19 | 0.10 | 2.46 | 0.88 | 8.64 | 0.15 | 2.49 | 0.24 | 2.75 | 1.65 | 13.79 | ||
| 阜康市 | # | # | # | # | 0.40 | -50.62 | 0.02 | 0.33 | 0.02 | 0.23 | 1.22 | -15.86 | ||
| 呼图壁县 | 0.02 | 0.40 | 0.01 | 0.25 | 0.56 | -30.86 | 0.15 | 2.49 | 0.24 | 2.75 | 1.56 | 7.59 | ||
| 玛纳斯县 | 0.11 | 2.19 | 0.08 | 1.97 | 0.73 | -9.88 | 0.27 | 4.49 | 0.51 | 5.85 | 1.88 | 29.66 | ||
| 奎屯市 | # | # | # | # | # | # | # | # | # | # | 1.50 | 3.45 | ||
| 霍城县 | 0.02 | 0.40 | 0.01 | 0.25 | 0.56 | -30.86 | 0.02 | 0.33 | 0.02 | 0.23 | 1.13 | -22.07 | ||
| 乌苏市 | 0.18 | 3.59 | 0.13 | 3.20 | 0.71 | -12.35 | 0.27 | 4.49 | 0.45 | 5.16 | 1.64 | 13.10 | ||
| 沙湾县 | 0.24 | 4.78 | 0.18 | 4.43 | 0.73 | -9.88 | 0.26 | 4.32 | 0.43 | 4.93 | 1.65 | 13.79 | ||
| 和布克赛尔 蒙古自治县 | # | # | # | # | # | # | # | # | # | # | 1.41 | -2.76 | ||
| 察布查尔 锡伯自治县 | 0.01 | 0.20 | # | # | 0.47 | -41.98 | 0.01 | 0.17 | 0.01 | 0.11 | 0.86 | -40.69 | ||
| 东疆 East Xinjiang | 吐鲁番高昌区 | 0.10 | 1.99 | 0.07 | 1.72 | 0.75 | -7.41 | 0.05 | 0.83 | 0.06 | 0.69 | 1.16 | -20.00 | |
| 鄯善县 | 0.07 | 1.39 | 0.06 | 1.48 | 0.75 | -7.41 | 0.03 | 0.50 | 0.05 | 0.57 | 1.34 | -7.59 | ||
| 托克逊县 | 0.09 | 1.79 | 0.08 | 1.97 | 0.87 | 7.41 | 0.05 | 0.83 | 0.07 | 0.80 | 1.22 | -15.86 | ||
| 哈密伊州区 | 0.03 | 0.60 | 0.02 | 0.49 | 0.78 | -3.70 | 0.06 | 1.00 | 0.07 | 0.80 | 1.19 | -17.93 | ||
| 棉区 Cotton area | 市(县) City (county) | 2010 | 2020 | |||||||||||
| 种植面积 Sown area (104 hm2) | 占总面积 Percentage of total area (%) | 总产量 Yield (108kg) | 占总产量 Percentage of yield (%) | 单产 Unit output (103 kg/hm2) | 较平均 单产增产 Increase in Unit output compared with the average(%) | 种植面积 Sown area (104 hm2) | 占总面积 Percentage of total area (%) | 总产量 Yield (108kg) | 占总产量 Percentage of Yield (%) | 单产 Unit output (103 kg/hm2) | 较平均 单产增产 Increase in Unit output compared with the average(%) | |||
| 北疆 North Xinjiang | 克拉玛依市 | 0.07 | 0.74 | 0.11 | 0.69 | 1.53 | -8.93 | 0.13 | 0.79 | 0.25 | 0.83 | 1.88 | 1.62 | |
| 昌吉市 | 0.23 | 2.43 | 0.38 | 2.39 | 1.61 | -4.17 | 0.31 | 1.89 | 0.54 | 1.78 | 1.72 | -7.03 | ||
| 博乐市 | 0.17 | 1.80 | 0.37 | 2.33 | 2.13 | 26.79 | 0.31 | 1.89 | 0.59 | 1.95 | 1.92 | 3.78 | ||
| 精河县 | 0.27 | 2.85 | 0.58 | 3.65 | 2.14 | 27.38 | 0.64 | 3.91 | 1.24 | 4.10 | 1.94 | 4.86 | ||
| 阜康市 | # | # | # | # | 1.23 | -26.79 | 0.14 | 0.86 | 0.26 | 0.86 | 1.82 | -1.62 | ||
| 呼图壁县 | 0.25 | 2.64 | 0.43 | 2.71 | 1.70 | 1.19 | 0.53 | 3.24 | 1.15 | 3.80 | 2.15 | 16.22 | ||
| 玛纳斯县 | 0.28 | 2.96 | 0.58 | 3.65 | 2.04 | 21.43 | 0.56 | 3.42 | 1.11 | 3.67 | 2.00 | 8.11 | ||
| 奎屯市 | 0.02 | 0.21 | 0.01 | 0.06 | 0.90 | -46.43 | 0.12 | 0.73 | 0.23 | 0.76 | 1.98 | 7.03 | ||
| 霍城县 | 0.01 | 0.11 | 0.01 | 0.06 | 1.14 | -32.14 | # | # | # | # | 1.61 | -12.97 | ||
| 乌苏市 | # | # | # | # | # | # | 1.17 | 7.15 | 2.09 | 6.90 | 1.78 | -3.78 | ||
| 沙湾县 | 0.47 | 4.96 | 0.76 | 4.78 | 1.61 | -4.17 | 1.20 | 7.33 | 2.21 | 7.30 | 1.87 | 1.08 | ||
| 和布克赛尔 蒙古自治县 | 0.07 | 0.74 | 0.10 | 0.63 | 1.52 | -9.52 | 0.06 | 0.37 | 0.10 | 0.33 | 1.77 | -4.32 | ||
| 察布查尔 锡伯自治县 | 0.08 | 0.84 | 0.09 | 0.57 | 1.17 | -30.36 | # | # | # | # | 1.54 | -16.76 | ||
| 东疆 East Xinjiang | 吐鲁番高昌区 | 0.04 | 0.42 | 0.05 | 0.31 | 1.28 | -23.81 | # | # | # | # | 1.30 | -29.73 | |
| 鄯善县 | 0.06 | 0.63 | 0.08 | 0.50 | 1.37 | -18.45 | # | # | 0.01 | 0.03 | 1.50 | -18.92 | ||
| 托克逊县 | 0.09 | 0.95 | 0.11 | 0.69 | 1.13 | -32.74 | 0.05 | 0.31 | 0.07 | 0.23 | 1.47 | -20.54 | ||
| 哈密伊州区 | 0.15 | 1.58 | 0.24 | 1.51 | 1.64 | -2.38 | 0.15 | 0.92 | 0.28 | 0.93 | 1.86 | 0.54 | ||
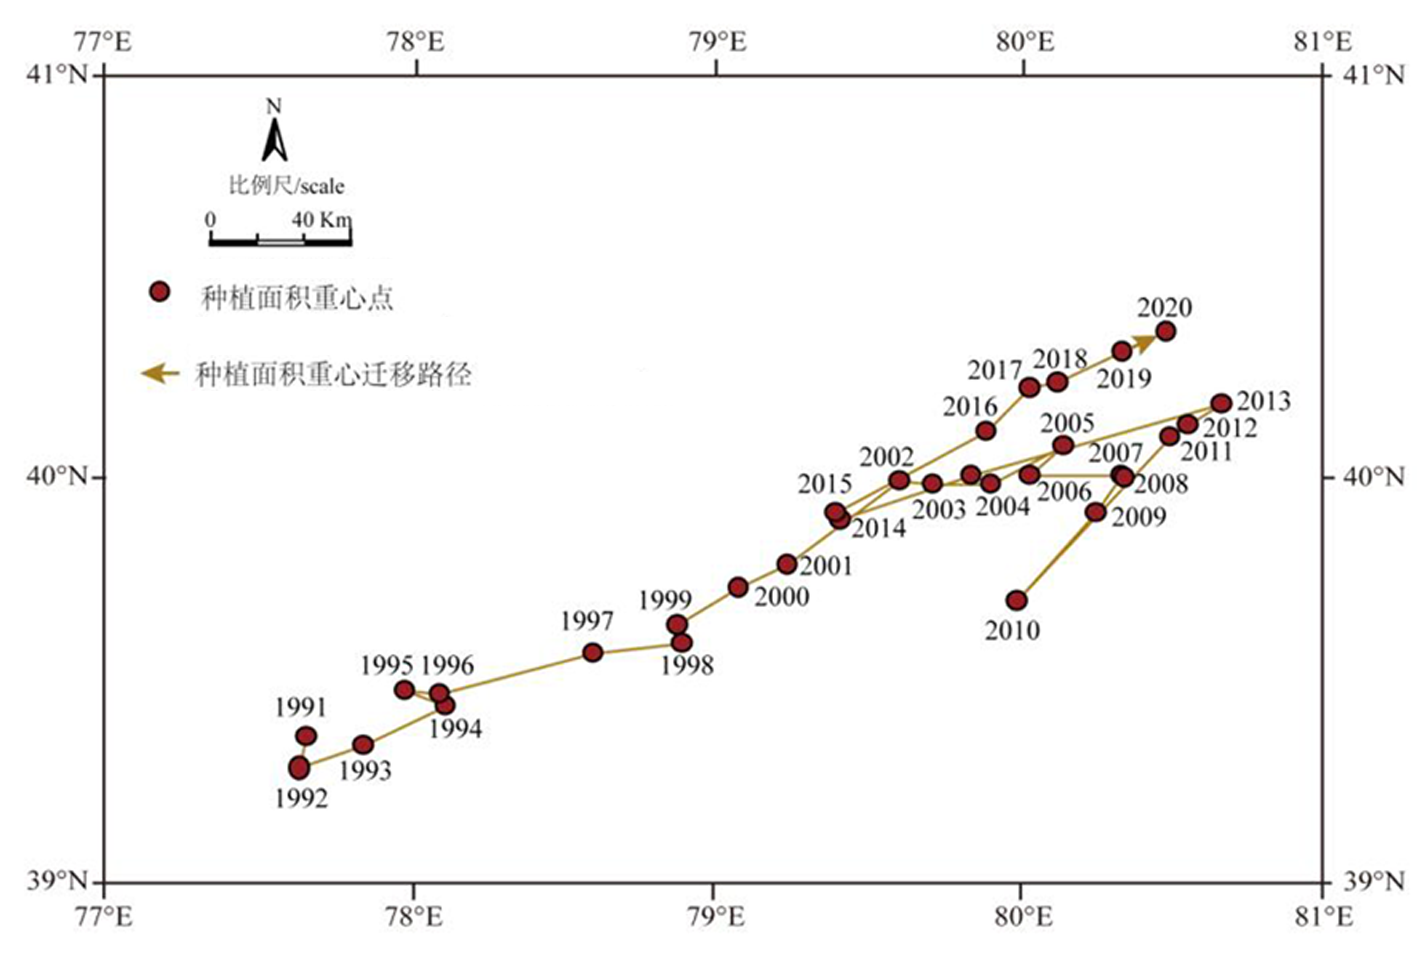
图2 1991~2020年新疆棉花种植面积重心迁移路径变化
Fig.2 Variations of the gravity of cotton area of Xinjiang in 1991-2020
| [1] |
吴湘琳, 陈宝燕, 蒲胜海. 等. 棉花SPAD值推荐施氮模型应用与修正[J]. 新疆农业科学, 2021, 58(7): 1275-1281.
DOI |
|
WU Xiangling, CHEN Baoyan, PU Shenghai, et al. Application and modification of recommended nitrogen application model for SPAD value of cotton[J]. Xinjiang Agricultural Sciences, 2021, 58(7): 1275-1281.
DOI |
|
| [2] | 张贺轩, 徐爱武. 新疆棉花生产地位分析[J]. 中国棉花加工, 2020, (4): 4-7. |
| Zhang Hexuan, Xu Aiwu. Analysis of cotton production status in Xinjiang[J]. China Cotton Processing, 2020, (4): 4-7. | |
| [3] | 辛明华, 王占彪, 韩迎春. 等. 新疆机采棉发展回顾, 现状分析及措施建议[J]. 中国农业科技导报, 2021, 23 (7) :11-20. |
|
XIN Minhua, WANG Zhanbiao, HAN Yingchun, et al. Review, status and measures of xinjiang machine-picked cotton[J]. Journal of Agricultural Science and Technology, 2021, 23 (7) :11-20.
DOI |
|
| [4] | 杨莉, 杨德刚, 张豫芳. 等. 新疆棉花种植面积时空格局演变特征及驱动机制研究[J]. 中国沙漠, 31(2):476-484. |
| YANG Li, YANG Degang, ZHANG Yufang, et al. Spatio-temporal Pattern Dynamic of Cotton Plantation in Xinj iang and its Driving Forces[J]. Journal of Desert Research, 31(2):476-484. | |
| [5] | 王晶, 肖海峰. 新疆棉区生产空间格局演化及驱动因素分析[J]. 中国农业资源与区划, 2018, 39(9): 155-161. |
| Wang Jing, Xiao Haifeng. Spatio temporal pattern and its driving facdtors of cotton production in Xinjiang[J]. Chinese Journal of Agricultural Regional Planning, 2018, 39(9): 155-161. | |
| [6] | 贺林均, 马威. 基于CR4分析的新疆棉花产业集群形成中的自然环境因素限制和影响分析[J]. 经济地理, 2013, 33(11): 97-103. |
| HE LinJun, MA Wei. Restrictions and impact analysis of natural environmental factors on xinjiang cotton industry cluster formation based on the analysis of CR4[J]. Economic Geography, 2013, 33(11): 97-103. | |
| [7] |
马春玥, 买买提·沙吾提, 姚杰. 新疆棉花种植业地理集聚特征及影响因素研究[J]. 作物学报, 2019, 45(12): 1859-1867.
DOI |
|
MA Chunyuez, Mamat Sawut, YAO Jie. Characteristics and influencing factors of geographical agglomeration of cotton plantation in Xinjiang[J]. Acta Agronomica Sinica, 2019, 45(12): 1859-1867.
DOI |
|
| [8] |
吕宁, 祝宏辉, 程文明. 农业化肥减量及生物肥料替代可行性研究-来自新疆棉区调查数据的实证[J]. 地理研究, 2022, 41(5): 1459-1480.
DOI |
|
LV Ning, ZHU Honghui, CHENG Wenming. Feasibility study on reduction of agricultural chemical fertilizer and substitution of bio-fertilizer: An empirical study of cotton survey data in Xinjiang[J]. Geographical Research, 2022, 41(5): 1459-1480.
DOI |
|
| [9] | 张亚飞, 张立杰. “一带一路”核心区农业碳排放与农业经济增长研究[J]. 东北农业科学, 2020, 45(2): 106-110. |
| ZHANG Yafei, ZHANG Lijie. Research on agricultural carbon emission and agricultural economic growth in ‘The Belt and Road’ core area[J]. Journal of Northeast Agricultural Sciences, 2020, 45(2): 106-110. | |
| [10] | 倪天麒, 田长彦, 胡文康. 新疆棉花生产中的重大问题与可持续发展对策[J]. 干旱区研究, 2002, 19(3): 57-61. |
| NI Tianqi, TIAN Changyan, HU Wenkang. Some vital problems in cotton countermeasures for achievi production in Xinjiang and the sustainable development[J]. Arid Zone Research, 2002, 19(3): 57-61. | |
| [11] | 姚源松. 新疆棉花区划新论[J]. 中国棉花, 2001, 28(2): 2-5. |
| Yao Yuansong. New theory on cotton regionalization in Xinjiang[J] China Cotton, 2001, 28 (2): 2-5 | |
| [12] | 吴海中, 田晓四, 陈保平. 安徽省粮食产量时空格局变化及安全评价[J]. 东北农业科学, 2021, 46(6): 109-113. |
| WU Haizhong, TIAN Xiaosi, CHEN Baoping. Spatio-temporal pattern change and safety evaluation of grain yield in Anhui province[J]. Journal of Northeast Agricultural Sciences, 2021, 46(6): 109-113. | |
| [13] |
刘杰安, 王小慧, 吴尧. 等. 近30年我国谷子生产时空变化与区域优势研究[J]. 中国农业科学, 2019, 52(11):1883-1894.
DOI |
|
LIU JieAn, WANG XiaoHui, WU Yao, et al. Spatiotemporal variation and regional advantages of foxtail mitillet production in recent 30 years in China[J]. Scientia Agricultura Sinica, 2019, 52(11): 1883-1894.
DOI |
|
| [14] |
LIU Z, LI Z, TANG P, et al. Change analysis of rice area and production in China during the past three decades[J]. Journal of Geographical Sciences, 2013, 23(6): 1005-1018.
DOI |
| [15] |
马春玥, 买买提·沙吾提, 姚杰. 等. 1950-2015年中国棉花生产时空动态变化[J]. 地理学报, 2020, 75(8): 1699-1710.
DOI |
|
MA Chunyue, Mamat Sawut, YAO Jie, et al. Spatio-temporal changes of cotton production in China from 1950 to 2015[J]. Acta Geographica Sinica, 2020, 75(8): 1699-1710.
DOI |
|
| [16] | 杨莉, 杨德刚, 张豫芳. 等. 新疆棉花种植面积时空格局演变特征及驱动机制研究[J]. 中国沙漠, 2011, 31(2): 476-484. |
| YANG Li, YANG Degang, ZHANG Yufang, et al. Spatio-temporal pattern dynamic of cotton plantation in Xinjiang and its driving forces[J]. Journal of Desert Research, 2011, 31(2): 476-484. | |
| [17] | 潘伟, 杨德刚, 杨莉. 等. 新疆棉花种植面积的时空变化及适度规模研究[J]. 中国生态农业学报, 2011, 19(2): 415-420. |
| PAN Wei, YANG Degang, YANG Li, et al. Spatio-temporal dynamics and optimal development scale of cotton industry in Xinjiang[J]. Chinese Journal of Eco-Agriculture, 2011, 19(2): 415-420. | |
| [18] | 王晶, 肖海峰. 耕地生态安全视域下棉花生产布局优化问题研究——以新疆为例[J]. 干旱区地理, 2018, 41(4): 833-843. |
| WANG Jing, XIAO Haifeng. A Optimization of the distribution of cotton production in Xinjiang under the view of cultivated land ecological security[J]. Arid lantd Geography, 2018, 41(4): 833-843. | |
| [19] | 刘捷. 新疆棉花产业国际竞争力研究[D]. 乌鲁木齐: 新疆财经大学, 2008. |
| Liu Jie. Research on international competitiveness of Xinjiang's cotton industry[D]. Urumqi: Xinjiang University of Finance and Economics, 2008 | |
| [20] |
娄善伟, 董合忠, 田晓莉. 新疆棉花“矮、密、早”栽培历史、现状和展望[J]. 中国农业科学, 2021, 54(4):720-732.
DOI |
| LOU Shanwei, DONG Hezhong, TIAN Xiaoli, et al. The “Short, Dense and Early” cultivation of cotton in Xinjiang: History, Current Situation and Prospect[J]. Scientia gricultura Sinica, 2021, 54(4):720-732. | |
| [21] | 尼合迈提·霍嘉. 从战略转移看新疆棉花和棉纺产业的发展[J]. 中国农村经济, 1997, (7): 63-65. |
| Nehemiaiti Huojia. The Development of Xinjiang cotton and cotton textile industry from the perspective of strategic transfer[J]. China Rural Economy, 1997, (7): 63-65. | |
| [22] | 程国强, 朱满德. 加强和完善农业直接补贴措施[J]. 经济研究参考, 2012, (24): 33-34. |
| Cheng Guoqiang, Zhu Mande. Strengthening and improving direct agricultural subsidies[J]. Economic Research Reference, 2012, (24): 33-34. | |
| [23] | 麦丹别克·安尼瓦尔, 热甫克提·阿布来提, 马腾. 等. 新疆2021年棉花生产剖析及未来种业发展方向[J]. 棉花科学, 2022, 44(1): 11-14. |
| Maidanbek Anwar, Rapkat Ablat, Ma Teng, et al. Analysis of cotton production and future development direction of seed industry in Xinjiang in 2021[J]. Cotton Sciences, 2022, 44 (1): 11-14. | |
| [24] | 王晓伟, 苗红萍, 刘卫东. 等. 目标价格对新疆地方棉区棉花规模的调控效应研究[J]. 中国农业资源与区划, 2017, 38(6):150-156. |
| Wang Xiaowei, Miao Hongping, Liu Weidong, et al. The regulatory role of target price on cotton scale in xinjiang local cotton regionv[J]. Chinese Journal of Agricultural Resources and Regional Planning, 2017, 38(6):150-156. | |
| [25] | 王力, 方质彬, 刘小凤. 等. 新疆棉花全要素生产率测算研究——基于剔除目标价格补贴政策影响的三阶段DEA-Malmquist模型[J]. 新疆农垦经济, 2022, (1):50-59. |
| Wang Li, Fang Zhibin, Liu Xiaofeng, et al. Calculation and analysis of total factor productivity of cotton in Xinjiang three-stage DEA-malmquist model based on excluding the influence of target price subsidy policy[J]. Xinjiang Land Reclamation Economy, 2022, (1):50-59. | |
| [26] | 刘传迹, 金晓斌, 徐伟义. 等. 2000-2020年南疆地区棉花种植空间格局及其变化特征分析[J]. 农业工程学报, 2021, 37(16):223-232. |
| Liu Chuanji, Jin Xiaobinl, Xu Weiyi, et al. Analysis of the spatial distribution and variation characteristics of cotton planting in southern Xinjiang from 2000 to 2020[J]. Transactions of the Chinese Society of Agricultural Engineering, 2021, 37(16):223-232. | |
| [27] |
马富裕, 刘扬, 崔静. 等. 水肥一体化研究进展[J]. 新疆农业科学, 2019, 56(1):183-192.
DOI |
|
MA Fuyu, LIU Yang, CUI Jing, et al. Review on the research progress of water and fertilizer integration[J]. Xinjiang Agricultural Sciences, 2019, 56(1):183-192.
DOI |
|
| [28] | 田立文, 徐海江, 孔杰. 等. 新疆棉花持续发展对策优化分析[J]. 中国纤检, 2018, (9): 110-113. |
| Tian Liwen, Xu Haijiang, Kong Jie, et al. Optimization Analysis of countermeasures for sustainable development of cotton in Xinjiang[J]. China Fiber Inspection, 2018, (9): 110-113. |
| [1] | 陈茂光, 林涛, 张昊, 刘海军, 王一帆, 汤秋香. 地膜类型对棉花生长的影响及自身降解和回收特性分析[J]. 新疆农业科学, 2023, 60(9): 2101-2108. |
| [2] | 杨川, 张凯, 陈冰, 张慧, 柳萍, 常松, 盛建东. 棉花植株形态特征对不同水分状况的响应[J]. 新疆农业科学, 2023, 60(9): 2120-2127. |
| [3] | 杨国江, 陈云, 林祥群, 何江勇, 刘盛林, 曲永清. 氮肥减施下有机肥替代对滴灌棉花产量、氮素吸收利用及土壤硝态氮的影响[J]. 新疆农业科学, 2023, 60(9): 2138-2145. |
| [4] | 李雪玲, 郭俊先, 陈莉, 宋鹤岭, 张众. 不同覆膜宽度对棉花农田环境的影响[J]. 新疆农业科学, 2023, 60(8): 1840-1847. |
| [5] | 阳妮, 玛依拉·玉素音, 杨延龙, 李春平, 张大伟, 徐海江, 赖成霞. 黄萎病枯斑型与黄化型病症棉花叶片的植物挥发物对比[J]. 新疆农业科学, 2023, 60(8): 1975-1986. |
| [6] | 米尔扎提·木塔力甫, 石秀楠, 柏军兵, 祖拜代·阿布都克日木, 吾勒加勒哈斯·阿扎提, 石书兵. 不同脱绒方式及PEG胁迫下对棉花种子活力及幼苗性状的影响[J]. 新疆农业科学, 2023, 60(7): 1561-1568. |
| [7] | 江柱, 张江辉, 白云岗, 杨鹏年, 刘洪波, 肖军, 刘旭辉. 膜下咸水滴灌水肥盐调控对棉花生长及产量的影响[J]. 新疆农业科学, 2023, 60(6): 1389-1397. |
| [8] | 王文涛, 吴博, 邰红忠, 练文明, 戴翠荣, 李双江, 蒲艳梅. 新疆阿拉尔垦区不同播期对棉花生长的影响[J]. 新疆农业科学, 2023, 60(6): 1413-1422. |
| [9] | 桑志伟, 梁亚军, 龚照龙, 郑巨云, 王俊铎, 李雪源, 陈全家. 不同陆地棉种质资源机采性状分析[J]. 新疆农业科学, 2023, 60(5): 1088-1098. |
| [10] | 逯涛, 曾庆涛, 张文, 王文博, 王政洋, 杨芮, 孙玉岩. 主成分分析及灰色关联度分析综合评价棉花产量与品质[J]. 新疆农业科学, 2023, 60(5): 1099-1109. |
| [11] | 王宁, 史应武, 牛新湘, 杨红梅, 楚敏, 詹发强, 包慧芳, 杨蓉, 龙宣杞, 丁荣荣. 棉花根际溶磷菌WJP-7发酵培养基优化及防病增产效果[J]. 新疆农业科学, 2023, 60(5): 1263-1270. |
| [12] | 张泓, 吐尔逊江·买买提, 张少民, 张军高, 周小云. 近30 a全国棉花生产区域时空变化及区域优势分析[J]. 新疆农业科学, 2023, 60(4): 1028-1040. |
| [13] | 代健敏, 张巨松, 徐新龙, 李始鑫, 翟梦华, 孙明辉. 氮肥运筹对雹后重播受旱棉花生长特性及产量影响[J]. 新疆农业科学, 2023, 60(4): 798-809. |
| [14] | 丁宇, 张江辉, 白云岗, 刘洪波, 郑明, 赵经华, 肖军, 韩政宇. 双膜条件下不同干播湿出水分处理对棉花生理、生长特性的影响[J]. 新疆农业科学, 2023, 60(4): 810-822. |
| [15] | 张宸, 梁悦, 殷昊, 张应榕, 陈波浪. 氮肥形态和品种对棉花根系形态与氮素积累的影响[J]. 新疆农业科学, 2023, 60(4): 823-831. |
| 阅读次数 | ||||||
|
全文 |
|
|||||
|
摘要 |
|
|||||