
新疆农业科学 ›› 2025, Vol. 62 ›› Issue (1): 202-209.DOI: 10.6048/j.issn.1001-4330.2025.01.023
王伟1( ), 张仁福1, 刘海洋1, 李晓维2, 姚举1()
收稿日期:2024-07-08
出版日期:2025-01-20
发布日期:2025-03-11
通信作者:
姚举(1969-),男,山东人,研究员,硕士,研究方向为棉花有害生物防治,(E-mail)yaoju500@sohu.com作者简介:王伟(1982-),男,天津人,研究员,博士,研究方向为棉花有害生物防治,(E-mail)wlzforever2004@sina.com
基金资助:
WANG Wei1(), ZHANG Renfu1, LIU Haiyang1, LI Xiaowei2, YAO Ju1()
Received:2024-07-08
Published:2025-01-20
Online:2025-03-11
Supported by:摘要:
【目的】 研究棉田花蓟马种群消长动态及空间分布型。【方法】 采用五点取样法进行田间取样;利用广义线性混合模型分析棉株叶片、花和棉铃上花蓟马种群动态;应用5种聚集度指标和Taylor幂法则分析棉田花蓟马的空间分布型。【结果】 棉田花蓟马种群数量从6月中旬至7月上中旬逐渐上升,7月中下旬至8月中旬达到高峰,8月下旬后至9月初逐渐下降直至消失。花蓟马种群数量在棉花的叶片、花和棉铃上存在显著性差异,种群随着调查时间的变化而波动,且种群随时间变化而波动在不同器官之间也存在显著性差异。在花蓟马种群的初始增长期、爆发高峰期、下降期及全时期中,花上具有最高的花蓟马种群数量。花蓟马在棉田的空间分布型为聚集分布,且聚集度具有密度依赖性。【结论】 7月中下旬至8月中旬是棉田花蓟马种群爆发期,其种群在棉田成聚集分布,且主要聚集于棉株花中。
中图分类号:
王伟, 张仁福, 刘海洋, 李晓维, 姚举. 新疆棉田花蓟马消长规律及空间分布[J]. 新疆农业科学, 2025, 62(1): 202-209.
WANG Wei, ZHANG Renfu, LIU Haiyang, LI Xiaowei, YAO Ju. Occurrence dynamics and spatial distribution pattern of Frankliniella intonsa in cotton fields in Xinjiang[J]. Xinjiang Agricultural Sciences, 2025, 62(1): 202-209.
| 指标 Indexes | 计算公式 Calculation formula | 备注 Remarks |
|---|---|---|
| 扩散系数(C) Diffusion coefficient (C) | C = S2/ m | C < 1时,均匀分布; C = 1时,随机分布;C > 1时,聚集分布。 |
| 丛生指标(I) Cluster index (I) | I = S2 / m - 1 | I < 0时,均匀分布;I = 0时,随机分布;I > 0时,聚集分布 |
| 负二项分布参数(k) Negative binomial parameter (k) | k = m2 / (S2 -m) | 8 > k > 0时,聚集分布;k < 0时,均匀分布;8< k → ∞时,随机分布. |
| Cassie指标(CA) Cassie index (CA) | CA = (S2/ m -1) / m | CA < 0时,均匀分布;CA = 0时,随机分布;CA > 0时,聚集分布。 |
| 平均拥挤度(m*) Average congestion degree (m*) | m*= m + (S2 -m) / m | m* < 1时,均匀分布;m* = 1时,随机分布;m* > 1时,聚集分布。 |
| 聚块指标(PI) Agglomeration index (PI) | m* / m | PI < 1时,均匀分布;PI = 1时,随机分布;当PI > 1时,聚集分布 |
| Taylor幂法则 Taylor model | lgS2=lga+ blgm | lga= 0、b = 0时,随机分布;lga > 0、b = 1时,聚集分布,但聚集度不依赖于密度;lga> 0、b > 1时,聚集分布,聚集度依赖于密度;lga> 0、b < 1时,均匀分布,种群密度越高越均匀。 |
表1 种群空间分布分析方法
Tab.1 Methods for assessing population spatial distribution
| 指标 Indexes | 计算公式 Calculation formula | 备注 Remarks |
|---|---|---|
| 扩散系数(C) Diffusion coefficient (C) | C = S2/ m | C < 1时,均匀分布; C = 1时,随机分布;C > 1时,聚集分布。 |
| 丛生指标(I) Cluster index (I) | I = S2 / m - 1 | I < 0时,均匀分布;I = 0时,随机分布;I > 0时,聚集分布 |
| 负二项分布参数(k) Negative binomial parameter (k) | k = m2 / (S2 -m) | 8 > k > 0时,聚集分布;k < 0时,均匀分布;8< k → ∞时,随机分布. |
| Cassie指标(CA) Cassie index (CA) | CA = (S2/ m -1) / m | CA < 0时,均匀分布;CA = 0时,随机分布;CA > 0时,聚集分布。 |
| 平均拥挤度(m*) Average congestion degree (m*) | m*= m + (S2 -m) / m | m* < 1时,均匀分布;m* = 1时,随机分布;m* > 1时,聚集分布。 |
| 聚块指标(PI) Agglomeration index (PI) | m* / m | PI < 1时,均匀分布;PI = 1时,随机分布;当PI > 1时,聚集分布 |
| Taylor幂法则 Taylor model | lgS2=lga+ blgm | lga= 0、b = 0时,随机分布;lga > 0、b = 1时,聚集分布,但聚集度不依赖于密度;lga> 0、b > 1时,聚集分布,聚集度依赖于密度;lga> 0、b < 1时,均匀分布,种群密度越高越均匀。 |

图1 花蓟马雌成虫 注:A.雌成虫;B.触角;C.前翅; D.头部;E.前胸背板;F.中后胸背板;G.腹节Ⅱ-Ⅲ;H.腹节Ⅲ-Ⅳ;I.腹节Ⅷ-Ⅹ
Fig.1 F.intonsa female adult Notes: A: female adult, B: antenna, C: fore-wing, D: head, E: pronotum, F: mesonotum & metanotum, G: sternites Ⅱ-Ⅲ, H: sternites Ⅲ-Ⅳ, I: sternites Ⅷ-Ⅹ.

图2 花蓟马雄成虫 注:A.雄成虫;B.触角;C.头部;D.前胸背板;E.中后胸背板;F.腹节Ⅰ-Ⅲ;G.腹节Ⅵ-Ⅶ;H.腹节Ⅷ-Ⅹ
Fig.2 F.intonsa male adult Notes: A: male adult, B: antenna, C: head, D: pronotum, E: mesonotum & metanotum, F: sternites Ⅰ-Ⅲ, G: sternites Ⅵ-Ⅶ, H: sternites Ⅷ-Ⅹ.

图3 烟蓟马雌成虫 注:A.雌成虫;B.触角;C.前翅; D.头部;E.前胸背板;F.中后胸背板;G.腹节Ⅱ-Ⅲ;H.腹节Ⅵ-Ⅶ;I.腹节Ⅷ-Ⅹ
Fig.3 T.tabaci female adult Notes: A: female adult, B: antenna, C: fore-wing, D: head, E: pronotum, F: mesonotum & metanotum, G: sternites Ⅱ-Ⅲ, H: sternites Ⅲ-Ⅳ, I: sternites Ⅷ-Ⅹ.
| 时间 Date | 采集点 Location | 棉花种类 Cotton type | 样品数量 Sample size | 烟蓟马 T.tabaci | 花蓟马 F.intonsa | ||
|---|---|---|---|---|---|---|---|
| 样品数量 Sample size | 百分比 Percentage(%) | 样品数量 Sample size | 百分比 Percentage(%) | ||||
| 5月 | 莎车县 | 陆地棉 | 11 | 11 | 100 | 0 | 0 |
| 巴楚县 | 陆地棉 | 12 | 11 | 91.67 | 1 | 8.33 | |
| 7月 | 阿克苏市① | 长绒棉 | 43 | 1 | 2.33 | 42 | 97.67 |
| 阿克苏市② | 陆地棉 | 64 | 0 | 0 | 64 | 100 | |
| 阿克苏市③ | 长绒棉 | 27 | 0 | 0 | 27 | 100 | |
| 库车市① | 陆地棉 | 27 | 0 | 0 | 27 | 100 | |
| 库车市② | 陆地棉 | 41 | 0 | 0 | 41 | 100 | |
| 巴楚县① | 陆地棉 | 35 | 0 | 0 | 35 | 100 | |
| 巴楚县② | 陆地棉 | 27 | 0 | 0 | 27 | 100 | |
| 巴楚县③ | 陆地棉 | 24 | 0 | 0 | 24 | 100 | |
| 8月 | 图木舒克市 | 陆地棉 | 72 | 0 | 0 | 72 | 100 |
| 库车市① | 陆地棉 | 84 | 0 | 0 | 84 | 100 | |
| 库车市② | 陆地棉 | 58 | 0 | 0 | 58 | 100 | |
| 库车市③ | 陆地棉 | 170 | 0 | 0 | 170 | 100 | |
| 新和县① | 陆地棉 | 144 | 0 | 0 | 144 | 100 | |
| 新和县② | 陆地棉 | 124 | 0 | 0 | 124 | 100 | |
| 新和县③ | 陆地棉 | 127 | 0 | 0 | 127 | 100 | |
表2 不同地域棉田蓟马鉴别
Tab.2 Identification results of thrips in the field of different geographical regions
| 时间 Date | 采集点 Location | 棉花种类 Cotton type | 样品数量 Sample size | 烟蓟马 T.tabaci | 花蓟马 F.intonsa | ||
|---|---|---|---|---|---|---|---|
| 样品数量 Sample size | 百分比 Percentage(%) | 样品数量 Sample size | 百分比 Percentage(%) | ||||
| 5月 | 莎车县 | 陆地棉 | 11 | 11 | 100 | 0 | 0 |
| 巴楚县 | 陆地棉 | 12 | 11 | 91.67 | 1 | 8.33 | |
| 7月 | 阿克苏市① | 长绒棉 | 43 | 1 | 2.33 | 42 | 97.67 |
| 阿克苏市② | 陆地棉 | 64 | 0 | 0 | 64 | 100 | |
| 阿克苏市③ | 长绒棉 | 27 | 0 | 0 | 27 | 100 | |
| 库车市① | 陆地棉 | 27 | 0 | 0 | 27 | 100 | |
| 库车市② | 陆地棉 | 41 | 0 | 0 | 41 | 100 | |
| 巴楚县① | 陆地棉 | 35 | 0 | 0 | 35 | 100 | |
| 巴楚县② | 陆地棉 | 27 | 0 | 0 | 27 | 100 | |
| 巴楚县③ | 陆地棉 | 24 | 0 | 0 | 24 | 100 | |
| 8月 | 图木舒克市 | 陆地棉 | 72 | 0 | 0 | 72 | 100 |
| 库车市① | 陆地棉 | 84 | 0 | 0 | 84 | 100 | |
| 库车市② | 陆地棉 | 58 | 0 | 0 | 58 | 100 | |
| 库车市③ | 陆地棉 | 170 | 0 | 0 | 170 | 100 | |
| 新和县① | 陆地棉 | 144 | 0 | 0 | 144 | 100 | |
| 新和县② | 陆地棉 | 124 | 0 | 0 | 124 | 100 | |
| 新和县③ | 陆地棉 | 127 | 0 | 0 | 127 | 100 | |
| 时间 Date (M/D) | 样本数量 Sample size | 鉴定结果 Result | |
|---|---|---|---|
| 种类 Species | 百分比 Percentage(%) | ||
| 6/20 | 46 | 花蓟马 | 100 |
| 6/25 | 47 | 花蓟马 | 100 |
| 6/30 | 49 | 花蓟马 | 100 |
| 7/5 | 59 | 花蓟马 | 100 |
| 7/10 | 95 | 花蓟马 | 100 |
| 7/14 | 107 | 花蓟马 | 100 |
| 7/16 | 136 | 花蓟马 | 100 |
| 7/24 | 270 | 花蓟马 | 100 |
| 7/30 | 241 | 花蓟马 | 100 |
| 8/5 | 107 | 花蓟马 | 100 |
| 8/10 | 79 | 花蓟马 | 100 |
| 8/15 | 58 | 花蓟马 | 100 |
| 8/23 | 26 | 花蓟马 | 100 |
| 8/28 | 21 | 花蓟马 | 100 |
| 9/3 | 8 | 花蓟马 | 100 |
| 合计 | 1 349 | ||
表3 田间蓟马样本鉴别
Tab.3 Identification results of thrips in the field
| 时间 Date (M/D) | 样本数量 Sample size | 鉴定结果 Result | |
|---|---|---|---|
| 种类 Species | 百分比 Percentage(%) | ||
| 6/20 | 46 | 花蓟马 | 100 |
| 6/25 | 47 | 花蓟马 | 100 |
| 6/30 | 49 | 花蓟马 | 100 |
| 7/5 | 59 | 花蓟马 | 100 |
| 7/10 | 95 | 花蓟马 | 100 |
| 7/14 | 107 | 花蓟马 | 100 |
| 7/16 | 136 | 花蓟马 | 100 |
| 7/24 | 270 | 花蓟马 | 100 |
| 7/30 | 241 | 花蓟马 | 100 |
| 8/5 | 107 | 花蓟马 | 100 |
| 8/10 | 79 | 花蓟马 | 100 |
| 8/15 | 58 | 花蓟马 | 100 |
| 8/23 | 26 | 花蓟马 | 100 |
| 8/28 | 21 | 花蓟马 | 100 |
| 9/3 | 8 | 花蓟马 | 100 |
| 合计 | 1 349 | ||
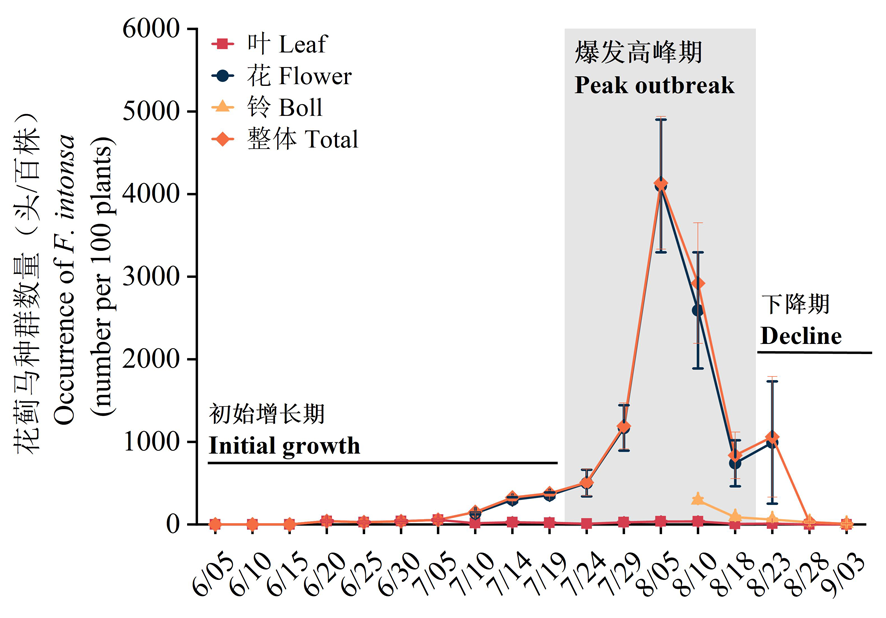
图4 棉田花蓟马消长动态
Fig.4 Dynamics of F.intonsa in cotton fields
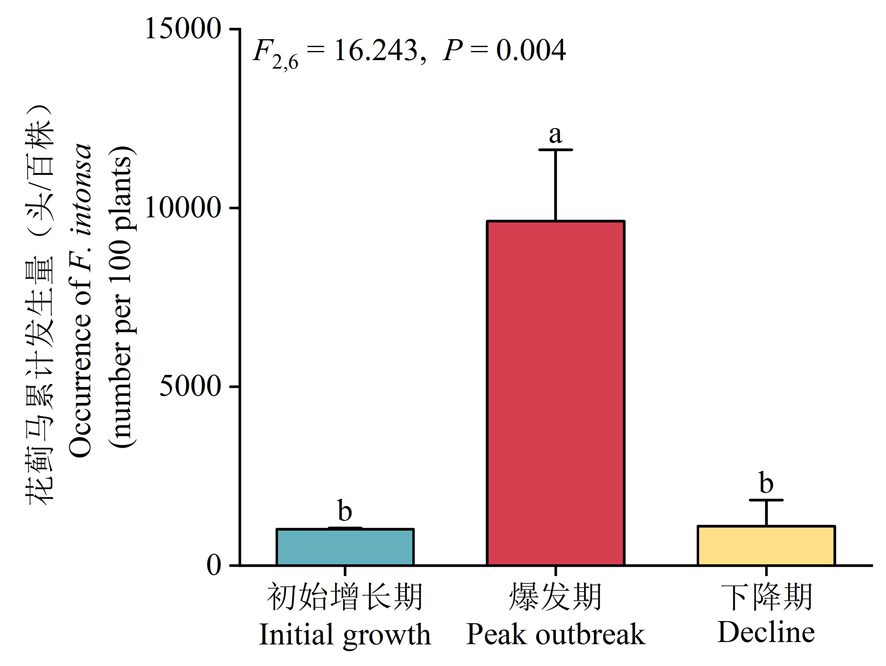
图5 不同时期花蓟马累计发生量的变化
Fig.5 Changes of cumulative occurrence of F.intonsa at different periods
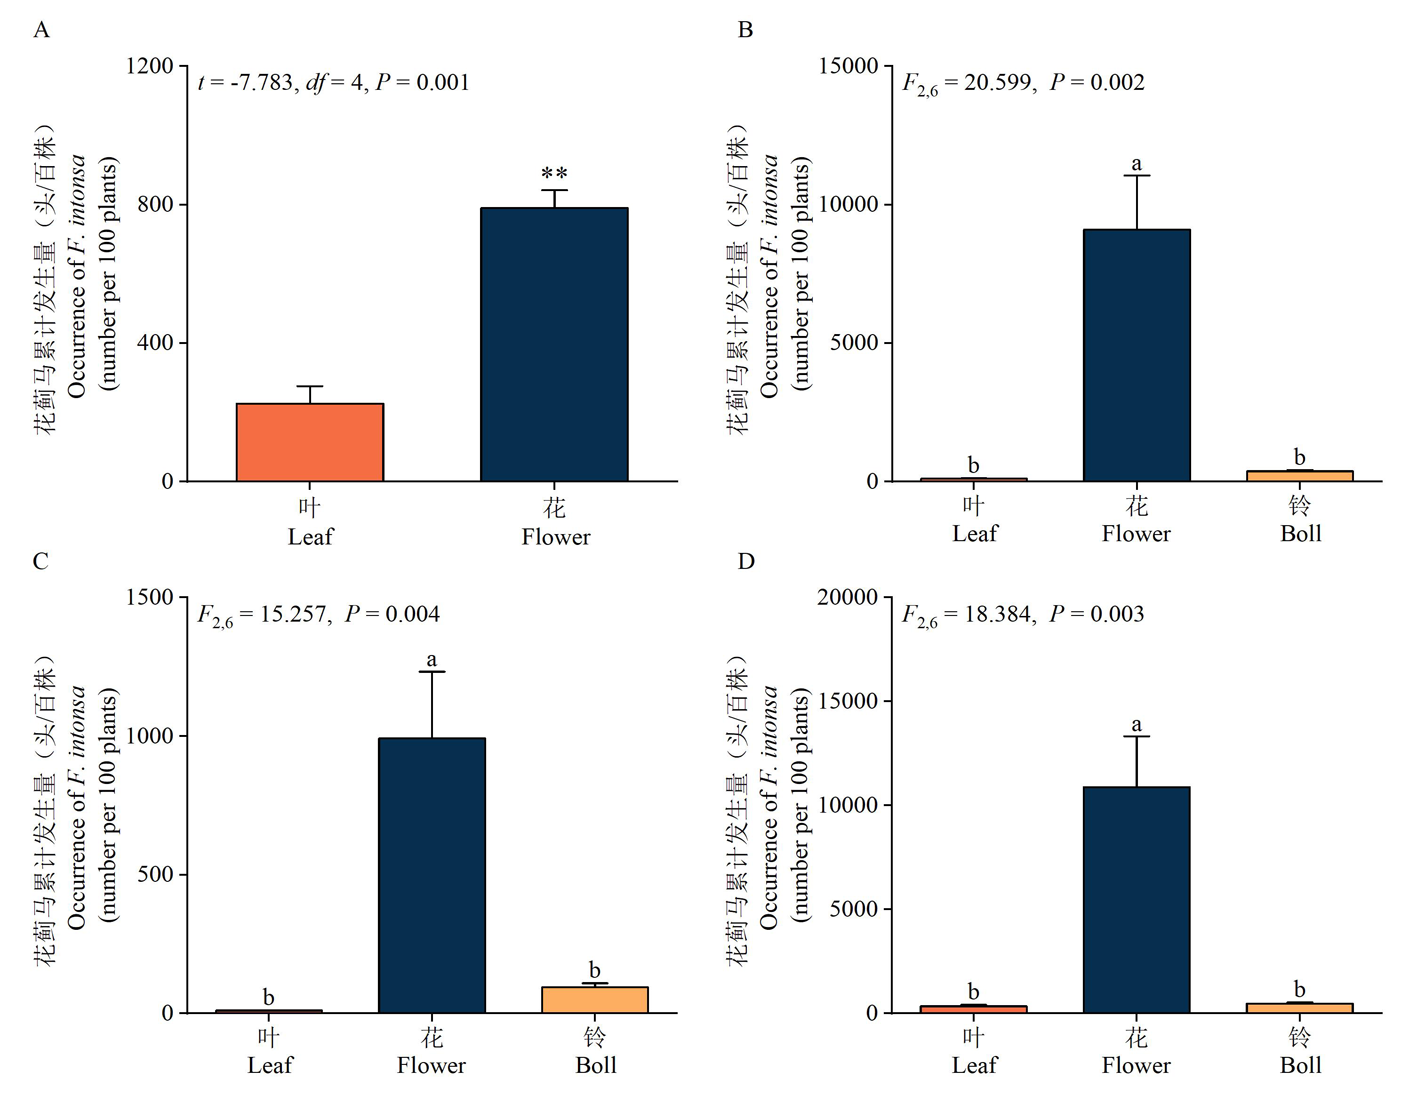
图6 不同时期花蓟马在棉株不同器官上的累计发生量的变化 注:图中数据为平均数±标准误。经Student's t检验,**表示在P < 0.01水平差异显著。经Duncan氏新复极差法检验,不同小写字母表示在P < 0.05水平差异显著。A:初始增长期,B:爆发高峰期,C:下降期,D:全时期
Fig.6 Changes of cumulative occurrence of F.intonsa on different organs of the cotton at different periods Notes: Data are mean±SE.** shows significant difference at P < 0.01 by Student's t test.Distinct lowercase letters show significant difference at P < 0.05 by Duncan's new multiple range test.A: initial growth period, B: peak outbreak period, C: decline period, D: total period.
| 日期 Date (M/D) | 样方均数 m | 方差 S2 | 扩散系数 C | 聚块指标 PI | 负二项参数 k | 丛生指标 I | 久野指数 CA | 分布型 Distribution pattern |
|---|---|---|---|---|---|---|---|---|
| 6/20 | 2.05 | 2.11 | 1.03 | 1.02 | 65.49 | 0.03 | 0.02 | 随机分布 |
| 6/25 | 1.33 | 6.69 | 5.02 | 4.01 | 0.33 | 4.02 | 3.01 | 聚集分布 |
| 6/30 | 1.93 | 4.10 | 2.12 | 1.58 | 1.73 | 1.12 | 0.58 | 聚集分布 |
| 7/05 | 2.80 | 3.96 | 1.41 | 1.15 | 6.76 | 0.41 | 0.15 | 聚集分布 |
| 7/10 | 7.57 | 47.31 | 6.25 | 1.69 | 1.44 | 5.25 | 0.69 | 聚集分布 |
| 7/14 | 16.27 | 87.73 | 5.39 | 1.27 | 3.70 | 4.39 | 0.27 | 聚集分布 |
| 7/19 | 18.82 | 54.62 | 2.90 | 1.10 | 9.89 | 1.90 | 0.10 | 聚集分布 |
| 7/24 | 25.40 | 283.74 | 11.17 | 1.40 | 2.50 | 10.17 | 0.40 | 聚集分布 |
| 7/29 | 59.63 | 1 081.10 | 18.13 | 1.29 | 3.48 | 17.13 | 0.29 | 聚集分布 |
| 8/05 | 208.57 | 12 897.58 | 61.84 | 1.29 | 3.43 | 60.84 | 0.29 | 聚集分布 |
| 8/10 | 145.98 | 18 064.38 | 123.74 | 1.84 | 1.19 | 122.74 | 0.84 | 聚集分布 |
| 8/18 | 41.82 | 4 164.55 | 99.59 | 3.36 | 0.42 | 98.59 | 2.36 | 聚集分布 |
| 8/23 | 53.03 | 14 083.97 | 265.57 | 5.99 | 0.20 | 264.57 | 4.99 | 聚集分布 |
| 8/28 | 1.43 | 4.08 | 2.85 | 2.29 | 0.78 | 1.85 | 1.29 | 聚集分布 |
| 9/03 | 0.37 | 0.60 | 1.63 | 2.73 | 0.58 | 0.63 | 1.73 | 聚集分布 |
表4 花蓟马种群的聚集度指标
Tab.4 Aggregation indices of F.intonsa populations
| 日期 Date (M/D) | 样方均数 m | 方差 S2 | 扩散系数 C | 聚块指标 PI | 负二项参数 k | 丛生指标 I | 久野指数 CA | 分布型 Distribution pattern |
|---|---|---|---|---|---|---|---|---|
| 6/20 | 2.05 | 2.11 | 1.03 | 1.02 | 65.49 | 0.03 | 0.02 | 随机分布 |
| 6/25 | 1.33 | 6.69 | 5.02 | 4.01 | 0.33 | 4.02 | 3.01 | 聚集分布 |
| 6/30 | 1.93 | 4.10 | 2.12 | 1.58 | 1.73 | 1.12 | 0.58 | 聚集分布 |
| 7/05 | 2.80 | 3.96 | 1.41 | 1.15 | 6.76 | 0.41 | 0.15 | 聚集分布 |
| 7/10 | 7.57 | 47.31 | 6.25 | 1.69 | 1.44 | 5.25 | 0.69 | 聚集分布 |
| 7/14 | 16.27 | 87.73 | 5.39 | 1.27 | 3.70 | 4.39 | 0.27 | 聚集分布 |
| 7/19 | 18.82 | 54.62 | 2.90 | 1.10 | 9.89 | 1.90 | 0.10 | 聚集分布 |
| 7/24 | 25.40 | 283.74 | 11.17 | 1.40 | 2.50 | 10.17 | 0.40 | 聚集分布 |
| 7/29 | 59.63 | 1 081.10 | 18.13 | 1.29 | 3.48 | 17.13 | 0.29 | 聚集分布 |
| 8/05 | 208.57 | 12 897.58 | 61.84 | 1.29 | 3.43 | 60.84 | 0.29 | 聚集分布 |
| 8/10 | 145.98 | 18 064.38 | 123.74 | 1.84 | 1.19 | 122.74 | 0.84 | 聚集分布 |
| 8/18 | 41.82 | 4 164.55 | 99.59 | 3.36 | 0.42 | 98.59 | 2.36 | 聚集分布 |
| 8/23 | 53.03 | 14 083.97 | 265.57 | 5.99 | 0.20 | 264.57 | 4.99 | 聚集分布 |
| 8/28 | 1.43 | 4.08 | 2.85 | 2.29 | 0.78 | 1.85 | 1.29 | 聚集分布 |
| 9/03 | 0.37 | 0.60 | 1.63 | 2.73 | 0.58 | 0.63 | 1.73 | 聚集分布 |
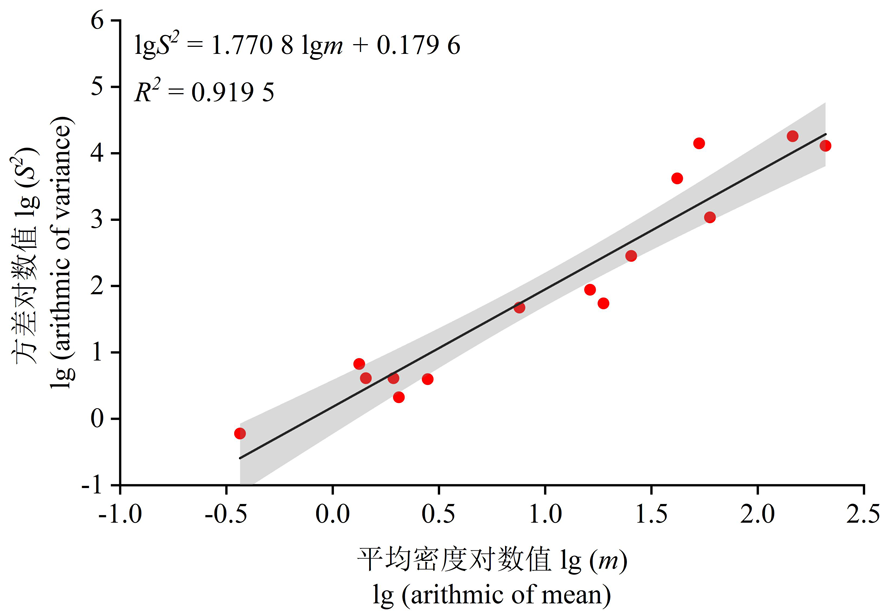
图7 花蓟马在棉田的空间分布Taylor回归模型方程
Fig.7 The Taylor models of F.intonsa in cotton field
| [1] | 北京农业大学. 昆虫学通论-下册(2版.)[M]. 北京: 农业出版社, 1993. |
| Beijing Agricultural University. General theory of entomology-volume II(2nd ed.)[M]. Beijing: China Agricultural Press, 1993. | |
| [2] | Morse J G, Hoddle M S. Invasion biology of Thrips[J]. Annual Review of Entomology, 2006, 51: 67-89. |
| [3] | Mirab-balou M, Tong X L, Feng J N, et al. Thrips (Insecta: Thysanoptera) of China[J]. Check List, 2011, 7(6): 720. |
| [4] |
Riley D G, Pappu H R. Tactics for management of Thrips (Thysanoptera: Thripidae) and tomato spotted wilt virus in tomato[J]. Journal of Economic Entomology, 2004, 97(5): 1648-1658.
DOI PMID |
| [5] | 张维球. 几种捕食性蓟马[J]. 昆虫天敌, 1980, 2(1): 1-6. |
| ZHANG Weiqiu. Several predatory Thrips[J]. Natural Enemies of Insects, 1980, 2(1): 1-6. | |
| [6] | 韩冬银, 邢楚明, 李磊, 等. 海南芒果蓟马种群的活动及消长规律[J]. 热带作物学报, 2015, 36(7): 1297-1301. |
| HAN Dongyin, XING Chuming, LI Lei, et al. Population activities and occurrence dynamics of Thrips in mango orchard[J]. Chinese Journal of Tropical Crops, 2015, 36(7): 1297-1301. | |
| [7] | 蒋兴川, 李志华, 曹志勇, 等. 蔬菜花期蓟马的种群动态与空间分布研究[J]. 应用昆虫学报, 2013, 50(6): 1628-1636. |
| JIANG Xingchuan, LI Zhihua, CAO Zhiyong, et al. Population dynamics and spatial distribution of Thrips on vegetables flowers[J]. Chinese Journal of Applied Entomology, 2013, 50(6): 1628-1636. | |
| [8] | 范咏梅, 童晓立, 高良举, 等. 普通大蓟马在海南豇豆上的空间分布型[J]. 环境昆虫学报, 2013, 35(6): 737-743. |
| FAN Yongmei, TONG Xiaoli, GAO Liangju, et al. The spatial aggregation pattern of dominant species of Thrips on cowpea in Hainan[J]. Journal of Environmental Entomology, 2013, 35(6): 737-743. | |
| [9] | 付步礼, 夏西亚, 邱海燕, 等. 香蕉园黄胸蓟马成虫种群的活动节律、消长规律与空间分布[J]. 生态学报, 2019, 39(13): 4996-5004. |
| FU Buli, XIA Xiya, QIU Haiyan, et al. Population activities, occurrence dynamics, and spatial distribution pattern of Thrips hawaiiensis in banana orchards[J]. Acta Ecologica Sinica, 2019, 39(13): 4996-5004. | |
| [10] | 丁岩钦. 昆虫种群数学生态学原理与应用[M]. 北京: 科学出版社, 1980. |
| DING Yanqin. Principle and application of mathematical ecology of insect population[M]. Beijing: Science Press, 1980. | |
| [11] | David F N, Moore P G. Notes on contagious distributions in plant populations[J]. Annals of Botany, 1954, 18(1): 47-53. |
| [12] | 韩铭哲. 关于负二项分布参数k值的讨论[J]. 生物数学学报, 1989, 4(2): 97-101. |
| HAN Mingzhe. A discussion on parameter k of negative binomial distribution[J]. Journal of Biomathematics, 1989, 4(2): 97-101. | |
| [13] | 戈峰. 昆虫生态学原理与方法[M]. 北京: 高等教育出版社, 2008. |
| GE Feng. Principle and methods of insect ecology[M]. Beijing: Higher Education Press, 2008. | |
| [14] | Lloyd M. Mean crowding[J]. Journal of Animal Ecology, 1967, 36(1): 1-30. |
| [15] | Taylor L R. Aggregation, variance and the mean[J]. Nature, 1961, 189: 732-735. |
| [16] | Bates D, Mächler M, Bolker B, et al. Fitting linear mixed-effects models using lme4[J]. Journal of Statistical Software, 2015, 67(1): 1-48. |
| [17] | 杨海峰, 王惠珍, 马祁. 棉田烟蓟马的发生与防治[J]. 新疆农业科学, 1985, 22(3): 24-25. |
| YANG Haifeng, WANG Huizhen, MA Qi. Occurrence and control of tobacco Thrips in cotton field[J]. Xinjiang Agricultural Sciences, 1985, 22(3): 24-25. | |
| [18] | 李国英. 新疆棉花病虫害及其防治[M]. 北京: 中国农业出版社, 2017: 207-211. |
| LI Guoying. Cotton pests and diseases in Xinjiang and their control[M]. Beijing: China Agriculture Press, 2017: 207-211. | |
| [19] |
Teerling C R, Pierce H D Jr, Borden J H, et al. Identification and bioactivity of alarm pheromone in the western flower Thrips, Frankliniella occidentalis[J]. Journal of Chemical Ecology, 1993, 19(4): 681-697.
DOI PMID |
| [20] | Hulshof J, Ketoja E, Vänninen I. Life history characteristics of Frankliniella occidentalis on cucumber leaves with and without supplemental food[J]. Entomologia Experimentalis et Applicata, 2003, 108(1): 19-32. |
| [21] | Zhi J R, Fitch G K, Margolies D C, et al. Apple pollen as a supplemental food for the western flower Thrips, Frankliniella occidentalis: response of individuals and populations[J]. Entomologia Experimentalis et Applicata, 2005, 117(3): 185-192. |
| [22] | 李强, 刘奎, 付步礼, 等. 不同食料对黄胸蓟马生物学特性的影响[J]. 环境昆虫学报, 2018, 40(1): 136-143. |
| LI Qiang, LIU Kui, FU Buli, et al. Effects of different diets on the biological characteristics of the Thrips hawaiiensis[J]. Journal of Environmental Entomology, 2018, 40(1): 136-143. | |
| [23] |
Hamilton J G C, Hall D R, Kirk W D J. Identification of a male-produced aggregation pheromone in the western flower Thrips Frankliniella occidentalis[J]. Journal of Chemical Ecology, 2005, 31(6): 1369-1379.
PMID |
| [24] |
Li X, Geng S, Zhang Z, et al. Species-specific aggregation pheromones contribute to coexistence in two closely related Thrips species[J]. Bulletin of Entomological Research, 2019, 109(1): 119-126.
DOI PMID |
| [1] | 孙彩琴, 吴佳, 黄海, 郭家鑫, 闵伟, 郭慧娟. 不同盐碱胁迫对棉花根系蛋白质组的影响[J]. 新疆农业科学, 2025, 62(1): 146-160. |
| [2] | 赖成霞, 杨延龙, 汪鹏龙, 朱梦宇, 杨栋, 李春平, 葛风伟, 玛依拉·玉素音, 阳妮, 马君. 新疆北疆部分棉区落叶型棉花黄萎病菌落形态特征及致病力鉴定[J]. 新疆农业科学, 2025, 62(1): 174-181. |
| [3] | 苗红萍, 王晓伟, 田聪华, 李志, 张玉新, 戴俊生. 塔里木河流域棉花生产与布局演变特征及驱动因素分析[J]. 新疆农业科学, 2024, 61(S1): 217-226. |
| [4] | 王俊铎, 崔豫疆, 梁亚军, 龚照龙, 郑巨云, 李雪源. 新疆棉花生产优势区域分析[J]. 新疆农业科学, 2024, 61(S1): 60-69. |
| [5] | 郑巨云, 龚照龙, 梁亚军, 耿世伟, 孙丰磊, 阳妮, 李雪源, 王俊铎. 新疆机采棉花生产关键技术模式[J]. 新疆农业科学, 2024, 61(S1): 70-74. |
| [6] | 李杰, 刘佳, 王亮, 张娜, 杨延龙, 郑子漂, 魏鑫, 王萌, 周子馨, 阳妮, 龚照龙, 侯献飞, 黄启秀, 阿不都卡地尔·库尔班, 张济鹏, 张鹏忠. “棉、油、糖”科技成果转化现状及应用分析[J]. 新疆农业科学, 2024, 61(S1): 89-94. |
| [7] | 扁青永, 付彦博, 祁通, 黄建, 蒲胜海, 孟阿静, 哈丽哈什·依巴提. 新疆南疆盐碱地棉花出苗影响因素及保苗措施分析[J]. 新疆农业科学, 2024, 61(S1): 95-100. |
| [8] | 李永泰, 高阿香, 李艳军, 张新宇. 脱叶剂对不同敏感性棉花品种生理特性的影响[J]. 新疆农业科学, 2024, 61(9): 2094-2102. |
| [9] | 张泽华, 叶含春, 王振华, 李文昊, 李海强, 刘健. 等氮配施脲酶抑制剂对滴灌棉花生长发育和产量及品质的影响[J]. 新疆农业科学, 2024, 61(9): 2103-2111. |
| [10] | 陈瑞杰, 罗林毅, 阮向阳, 冶军. 腐植酸对滴灌棉田土壤养分和棉花产量及品质的影响[J]. 新疆农业科学, 2024, 61(9): 2112-2121. |
| [11] | 黄铂轩, 李鹏程, 郑苍松, 孙淼, 邵晶晶, 冯卫娜, 庞朝友, 徐文修, 董合林. 不同氮素抑制剂对棉花生长发育、氮素利用与产量的影响[J]. 新疆农业科学, 2024, 61(9): 2122-2131. |
| [12] | 王超, 徐文修, 李鹏程, 郑苍松, 孙淼, 冯卫娜, 邵晶晶, 董合林. 棉花苗期生长发育对土壤速效钾水平的响应[J]. 新疆农业科学, 2024, 61(9): 2132-2139. |
| [13] | 肖淑婷, 颜安, 王卫霞, 张青青, 侯正清, 马梦倩, 孙哲. 天山中部典型林区地上生物量时空变化及影响因素分析[J]. 新疆农业科学, 2024, 61(9): 2237-2244. |
| [14] | 张庭军, 李字辉, 崔豫疆, 孙孝贵, 陈芳. 微生物菌剂对棉花生长及土壤理化性质的影响[J]. 新疆农业科学, 2024, 61(9): 2269-2276. |
| [15] | 董志多, 徐菲, 付秋萍, 黄建, 祁通, 孟阿静, 付彦博, 开赛尔·库尔班. 不同类型盐碱胁迫对棉花种子萌发的影响[J]. 新疆农业科学, 2024, 61(8): 1831-1844. |
| 阅读次数 | ||||||||||||||||||||||||||||||||||||||||||||||||||
|
全文 15
|
|
|||||||||||||||||||||||||||||||||||||||||||||||||
|
摘要 75
|
|
|||||||||||||||||||||||||||||||||||||||||||||||||