
新疆农业科学 ›› 2024, Vol. 61 ›› Issue (4): 845-851.DOI: 10.6048/j.issn.1001-4330.2024.04.007
• 作物遗传育种·种质资源·分子遗传学·生理生化 • 上一篇 下一篇
张磊1,2( ), 姚梦瑶2,3, 刘志刚2, 李娟2, 杨洋2, 蔡大润2, 陈果2, 李波2, 李晓荣2, 陈勋基2, 翟云龙1()
收稿日期:2023-09-11
出版日期:2024-04-20
发布日期:2024-05-31
通信作者:
翟云龙(1979-),男,河南扶沟人,教授,博士,硕士生导师,研究方向为作物高产,(E-mail)zylzky@163.com作者简介:张磊(1999-),男,甘肃武威人,硕士研究生,研究方向为玉米遗传育种,(E-mail)1822835613@qq.com
基金资助:
ZHANG Lei1,2(), YAO Mengyao2,3, LIU Zhigang2, LI Juan2, YANG Yang2, CAI Darun2, CHEN Guo2, LI Bo2, LI Xiaorong2, CHEN Xunji2, ZHAI Yunlong1()
Received:2023-09-11
Published:2024-04-20
Online:2024-05-31
Correspondence author:
ZHAI Yunlong (1979-), male, from Fugou, Henan,professor,Ph.D., the research diretion of high yield theory and technology of crops,(E-mail)zylzky@163.comSupported by:摘要:
【目的】研究基于UAS-8无人机采集数据,运用归一化植被指数(Normalized Difference Vegetation Index)模型估测玉米产量,为大田无人机多光谱预测玉米产量提供理论依据。【方法】以新疆18份春播玉米为研究对象,获取开花期多光谱图像,经过辐射校正、大气校正、建立掩膜、提取NDVI图,计算植被覆盖率,得到区光谱反射率和归一化植被指数实际数值,将NDVI值与田间实测产量值进行模型拟合。【结果】幂函数Y = 23 411.46-10 997.99 / X(R2 = 0.488 6),二次函数为Y = 39 003.00-117 963.03X + 103 130.25X2(R2 =0.562),正反比函数(Inverse Proportional Function)为Y2 = 2 840.5 X/(1-X)(R2 = 0.495),利用偏最小二乘回归(Partial Least Squares Regression),其线性函数 Y = 24 458.22X-9 620.55(R2 =0.521)。【结论】在数值0.5~0.8区间,NDVI与玉米产量具有较高的相关性,线性函数方程NDVI值可预测玉米的产量。
中图分类号:
张磊, 姚梦瑶, 刘志刚, 李娟, 杨洋, 蔡大润, 陈果, 李波, 李晓荣, 陈勋基, 翟云龙. 基于无人机多光谱NDVI值估测玉米产量[J]. 新疆农业科学, 2024, 61(4): 845-851.
ZHANG Lei, YAO Mengyao, LIU Zhigang, LI Juan, YANG Yang, CAI Darun, CHEN Guo, LI Bo, LI Xiaorong, CHEN Xunji, ZHAI Yunlong. Research of maize yield estimation based on unmanned aerial vehicle multispectral NDVI[J]. Xinjiang Agricultural Sciences, 2024, 61(4): 845-851.
| 玉米种质名称 Corn germplasm name | NDVI | 实测产量 Measured yield (kg/hm2) |
|---|---|---|
| 20HN009×16F | 0.746 771 | 6 309.52 |
| 20HN064×DB614 | 0.781 470 | 7 261.90 |
| 20HN068×DB614 | 0.634 637 | 4 404.76 |
| 20HN069×DB614 | 0.663 515 | 5 595.23 |
| 20HN070×DB614 | 0.792 066 | 11 666.66 |
| 20HN084×DB614 | 0.672 930 | 6 071.42 |
| 20HN086×DB614 | 0.781 432 | 9 880.95 |
| 20HN096×DB614 | 0.565 060 | 5 476.19 |
| 20HN102×DB614 | 0.603 867 | 5 833.33 |
| 20HN104×DB614 | 0.743 107 | 9 523.80 |
| 20HN142×DB614 | 0.728 815 | 7 142.85 |
| 20HN152×DB614 | 0.748 561 | 6 666.66 |
| 20HN094×1487F | 0.719 880 | 10 476.19 |
| 20HN095×1487F | 0.794 545 | 11 071.42 |
| 20HN098×1487F | 0.793 120 | 10 833.34 |
| 20HN107×1487F | 0.740 062 | 9 523.80 |
| 20HN153×K487F | 0.728 140 | 9 880.95 |
| 20HN326×A55 | 0.756 129 | 7 023.80 |
表1 18份玉米材料产量及NDVI数值
Tab.1 18 corn material yields correspond to NDVI tables
| 玉米种质名称 Corn germplasm name | NDVI | 实测产量 Measured yield (kg/hm2) |
|---|---|---|
| 20HN009×16F | 0.746 771 | 6 309.52 |
| 20HN064×DB614 | 0.781 470 | 7 261.90 |
| 20HN068×DB614 | 0.634 637 | 4 404.76 |
| 20HN069×DB614 | 0.663 515 | 5 595.23 |
| 20HN070×DB614 | 0.792 066 | 11 666.66 |
| 20HN084×DB614 | 0.672 930 | 6 071.42 |
| 20HN086×DB614 | 0.781 432 | 9 880.95 |
| 20HN096×DB614 | 0.565 060 | 5 476.19 |
| 20HN102×DB614 | 0.603 867 | 5 833.33 |
| 20HN104×DB614 | 0.743 107 | 9 523.80 |
| 20HN142×DB614 | 0.728 815 | 7 142.85 |
| 20HN152×DB614 | 0.748 561 | 6 666.66 |
| 20HN094×1487F | 0.719 880 | 10 476.19 |
| 20HN095×1487F | 0.794 545 | 11 071.42 |
| 20HN098×1487F | 0.793 120 | 10 833.34 |
| 20HN107×1487F | 0.740 062 | 9 523.80 |
| 20HN153×K487F | 0.728 140 | 9 880.95 |
| 20HN326×A55 | 0.756 129 | 7 023.80 |
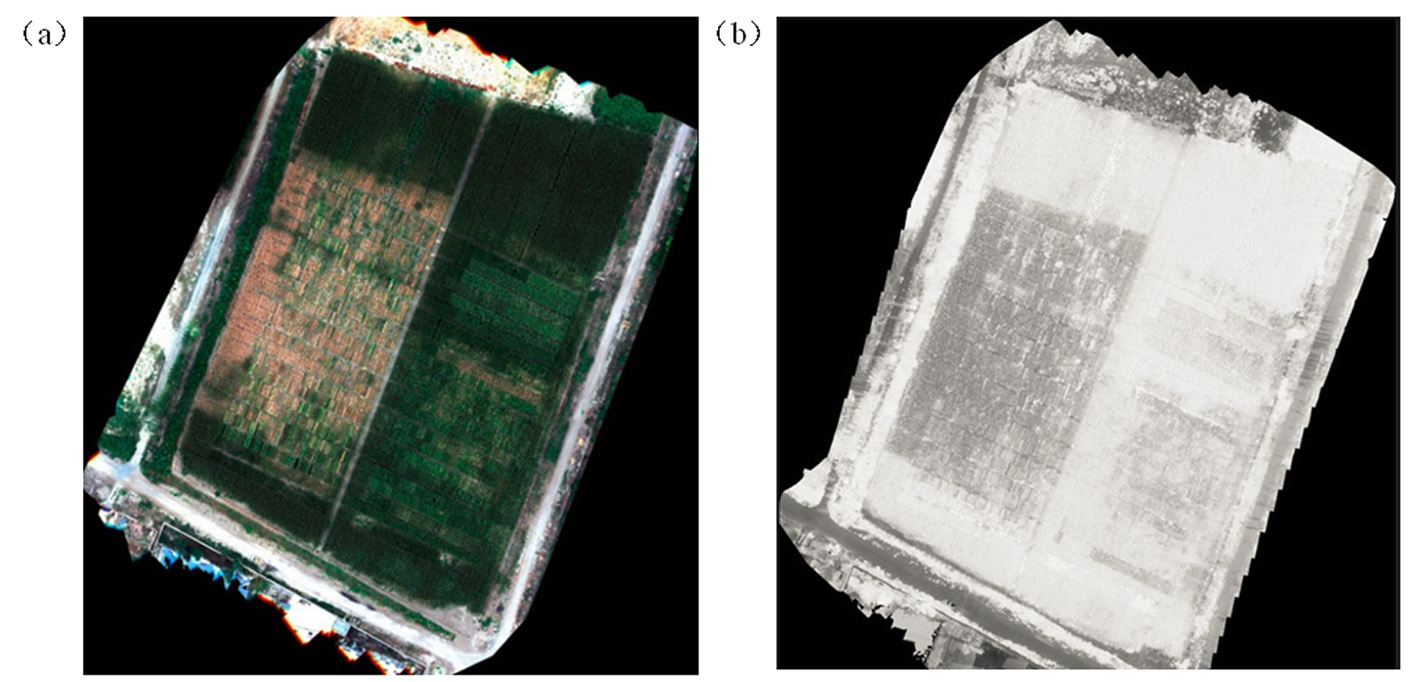
图1 无人机处理后图像 注:(a)伪彩色图像 (b)NDVI图像
Fig.1 Drone processed images Note:(a)False color image (b) NDVI image
| 名称 Name | 无人机 Unmanned aerial vehicle | 多光谱相机 Multispectral camera |
|---|---|---|
| 型号Model | EcoDrone® UAS-8 | MicaSense Red Edge-MTM |
| 尺寸Size | 1 632 mm × 1 632 mm × 650 mm(螺旋桨、GPS支架均展开) | 94 mm × 63 mm× 46 mm |
| 重量 Weight | 10 kg(最大载荷6 kg) | 170 g (包括DLS) |
| 焦距 Focal length | 35 mm | |
| 最大分辨率 Maximum resolution | 1 280 × 960 | |
| 光谱带 Spectval band | R、G、B、NIR、Red edge | |
| 作业时间 Operation time | 30 min | 30 min |
| 最大可承受风速 Maximum tolerable wind speed | 10 m/s(5级风可安全飞行)、 瞬间可承受13 m/s (6级风) | 10 m/s(5级风可安全飞行)、 瞬间可承受13 m/s (6级风) |
表2 无人机遥感平台参数
Tab.2 Parameter of UAV remote sensing platform
| 名称 Name | 无人机 Unmanned aerial vehicle | 多光谱相机 Multispectral camera |
|---|---|---|
| 型号Model | EcoDrone® UAS-8 | MicaSense Red Edge-MTM |
| 尺寸Size | 1 632 mm × 1 632 mm × 650 mm(螺旋桨、GPS支架均展开) | 94 mm × 63 mm× 46 mm |
| 重量 Weight | 10 kg(最大载荷6 kg) | 170 g (包括DLS) |
| 焦距 Focal length | 35 mm | |
| 最大分辨率 Maximum resolution | 1 280 × 960 | |
| 光谱带 Spectval band | R、G、B、NIR、Red edge | |
| 作业时间 Operation time | 30 min | 30 min |
| 最大可承受风速 Maximum tolerable wind speed | 10 m/s(5级风可安全飞行)、 瞬间可承受13 m/s (6级风) | 10 m/s(5级风可安全飞行)、 瞬间可承受13 m/s (6级风) |
| 影像号顺序 Image number order | 波段 Band (nm) | 波段类型 Band type | 波段宽度 Band width (nm) |
|---|---|---|---|
| 1 | 475 | Blue | 20 |
| 2 | 560 | Green | 20 |
| 3 | 668 | Red | 10 |
| 4 | 840 | NIR | 40 |
| 5 | 717 | Red Edge | 10 |
表3 多光谱相机各影像顺序与对应波段类型和宽度
Tab.3 The order of images of multispectral cameras and the corresponding band type and width
| 影像号顺序 Image number order | 波段 Band (nm) | 波段类型 Band type | 波段宽度 Band width (nm) |
|---|---|---|---|
| 1 | 475 | Blue | 20 |
| 2 | 560 | Green | 20 |
| 3 | 668 | Red | 10 |
| 4 | 840 | NIR | 40 |
| 5 | 717 | Red Edge | 10 |
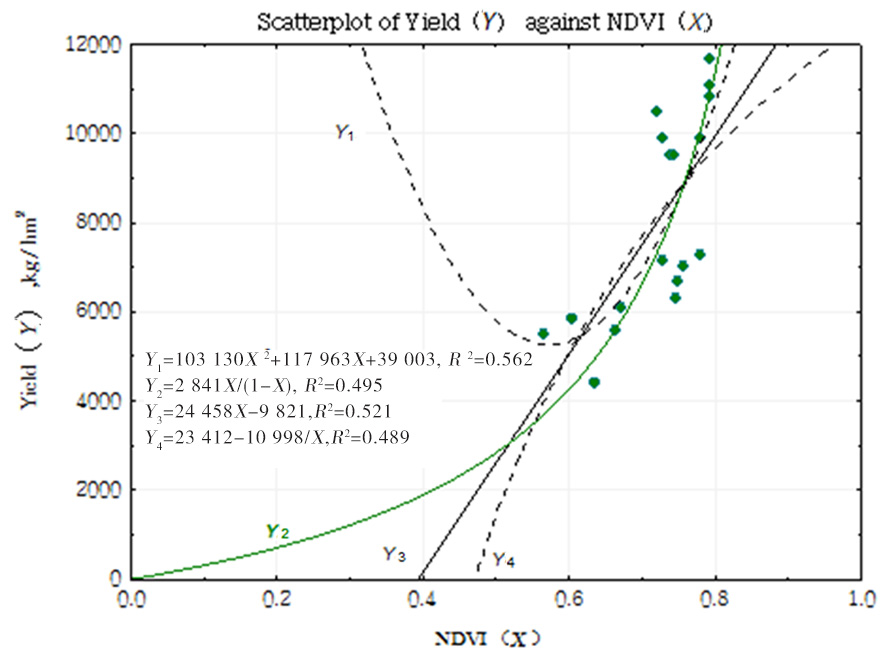
图2 四种估产模型拟合结果
Fig.2 Fitness of four yield-estimating models
| 估产模型Estimation Model | 表达式Expression | R2 |
|---|---|---|
| 二次函数Quadratic Function | Y1 = 103 130 X2-117 963 X+39 003 | 0.562 |
| 正反比函数Inverse Proportional Function | Y2 = 2 840.5 X/(1-X) | 0.495 |
| 线性函数 Linear Function | Y3 = 24 458 X-9 621 | 0.521 |
| 幂函数Power Function | Y4 = 23 412-10 998/ X | 0.489 |
表4 四种估产模型拟合结果
Tab.4 Four production estimation models
| 估产模型Estimation Model | 表达式Expression | R2 |
|---|---|---|
| 二次函数Quadratic Function | Y1 = 103 130 X2-117 963 X+39 003 | 0.562 |
| 正反比函数Inverse Proportional Function | Y2 = 2 840.5 X/(1-X) | 0.495 |
| 线性函数 Linear Function | Y3 = 24 458 X-9 621 | 0.521 |
| 幂函数Power Function | Y4 = 23 412-10 998/ X | 0.489 |
| 估产模型 Estimation model | 绝对误差Absolute error(kg/hm2 ) | 相对误差Relative error(%) | ||||
|---|---|---|---|---|---|---|
| 最大值 Max | 最小值 Min | 均值 Mean | 最大值 Max | 最小值 Min | 均值 Mean | |
| 二次函数 Quadratic Functions | 2 947.50 | 83.00 | 1 216.86 | 28.13 | 0.84 | 15.79 |
| 正反比函数 Inverse Proportional Function | 3 176.39 | 5.94 | 1 251.98 | 30.32 | 0.10 | 16.63 |
| 线性函数 Linear functions | 2 489.75 | 389.07 | 1 419.35 | 23.76 | 3.93 | 19.02 |
| 幂函数 Power function | 2 374.54 | 543.65 | 1 493.19 | 37.63 | 5.50 | 20.14 |
表5 不同产量预测模型精度
Tab.5 Accuracy analysis of different yield forecast models
| 估产模型 Estimation model | 绝对误差Absolute error(kg/hm2 ) | 相对误差Relative error(%) | ||||
|---|---|---|---|---|---|---|
| 最大值 Max | 最小值 Min | 均值 Mean | 最大值 Max | 最小值 Min | 均值 Mean | |
| 二次函数 Quadratic Functions | 2 947.50 | 83.00 | 1 216.86 | 28.13 | 0.84 | 15.79 |
| 正反比函数 Inverse Proportional Function | 3 176.39 | 5.94 | 1 251.98 | 30.32 | 0.10 | 16.63 |
| 线性函数 Linear functions | 2 489.75 | 389.07 | 1 419.35 | 23.76 | 3.93 | 19.02 |
| 幂函数 Power function | 2 374.54 | 543.65 | 1 493.19 | 37.63 | 5.50 | 20.14 |
| 估产模型 Estimation model | ME | RMSE (kg/hm2 ) | SD |
|---|---|---|---|
| 二次函数 Quadratic Functions | 1 374.70 | 443.12 | 1 716.21 |
| 正反比函数 Inverse Proportional Function | 1 791.36 | 536.10 | 2 274.49 |
| 线性函数 Linear functions | 1 285.96 | 390.41 | 1 656.41 |
| 幂函数 power function | 1 227.69 | 539.59 | 2 224.78 |
表6 实际产量与预测产量误差统计
Tab.6 Statistical analysis of the error between actual output and predicted output
| 估产模型 Estimation model | ME | RMSE (kg/hm2 ) | SD |
|---|---|---|---|
| 二次函数 Quadratic Functions | 1 374.70 | 443.12 | 1 716.21 |
| 正反比函数 Inverse Proportional Function | 1 791.36 | 536.10 | 2 274.49 |
| 线性函数 Linear functions | 1 285.96 | 390.41 | 1 656.41 |
| 幂函数 power function | 1 227.69 | 539.59 | 2 224.78 |
| [1] | 李学国. 基于无人机遥感光谱图像的小麦玉米长势精准监测研究[D]. 泰安: 山东农业大学, 2019. |
| LI Xueguo. Study on Precise Monitoring of Wheat and Corn Growth Based on Remote Sensing Image of Unmanned Aerial Vehicle[D]. Taian: Shandong Agricultural University, 2019. | |
| [2] | 陈怀亮, 李颖, 张红卫. 农作物长势遥感监测业务化应用与研究进展[J]. 气象与环境科学, 2015, 38(1): 95-102. |
| CHEN Huailiang, LI Ying, ZHANG Hongwei. Operational application and research review of crop growth monitoring with remote sensing[J]. Meteorological and Environmental Sciences, 2015, 38(1): 95-102. | |
| [3] | 高林, 杨贵军, 王宝山, 等. 基于无人机遥感影像的大豆叶面积指数反演研究[J]. 中国生态农业学报, 2015, 23(7): 868-876. |
| GAO Lin, YANG Guijun, WANG Baoshan, et al. Soybean leaf area index retrieval with UAV(unmanned aerial vehicle) remote sensing imagery[J]. Chinese Journal of Eco-Agriculture, 2015, 23(7): 868-876. | |
| [4] | Han X Z, Thomasson J A, Bagnall G C, et al. Measurement and calibration of plant-height from fixed-wing UAV images[J]. Sensors, 2018, 18(12): 4092. |
| [5] | Shafian S, Rajan N, Schnell R, et al. Using a fixed wing UAV remote sensing system for Sorghum Crop Phenotyping [A]// 2016: B53H-B612H. |
| [6] | Geipel J, Link J, Claupein W. Combined spectral and spatial modeling of corn yield based on aerial images and crop surface models acquired with an unmanned aircraft system[J]. Remote Sensing, 2014, 6(11): 10335-10355. |
| [7] | Magney T S, Eitel J U H, Huggins D R, et al. Proximal NDVI derived phenology improves in-season predictions of wheat quantity and quality[J]. Agricultural and Forest Meteorology, 2016, 217: 46-60. |
| [8] | Foster A J, Kakani V G, Mosali J. Estimation of bioenergy crop yield and N status by hyperspectral canopy reflectance and partial least square regression[J]. Precision Agriculture, 2017, 18(2): 192-209. |
| [22] | 贺佳, 王来刚, 郭燕, 等. 基于无人机多光谱遥感的玉米LAI估算研究[J]. 农业大数据学报, 2021, 3(4): 20-28. |
| HE Jia, WANG Laigang, GUO Yan, et al. Research on maize LAI estimation based on UAV multispectral remote sensing[J]. Journal of Agricultural Big Data, 2021, 3(4): 20-28. | |
| [9] | Samborski S M, Gozdowski D, Walsh O S, et al. Winter wheat genotype effect on canopy reflectance: implications for using NDVI for In-season nitrogen topdressing recommendations[J]. Agronomy Journal, 2015, 107(6): 2097-2106. |
| [10] | Rutkoski J, Poland J, Mondal S, et al. Canopy temperature and vegetation indices from high-throughput phenotyping improve accuracy of pedigree and genomic selection for grain yield in wheat[J]. G3 Genes|Genomes|Genetics, 2016, 6(9): 2799-2808. |
| [11] | Kumar S, Röder M S, Singh R P, et al. Mapping of spot blotch disease resistance using NDVI as a substitute to visual observation in wheat (Triticum aestivum L.)[J]. Molecular Breeding, 2016, 36(7): 95. |
| [12] | Kyratzis A, Skarlatos D, Fotopoulos V, et al. Investigating correlation among NDVI index derived by unmanned aerial vehicle photography and grain yield under late drought stress conditions[J]. Procedia Environmental Sciences, 2015, 29: 225-226. |
| [13] | Babar M A, Reynolds M P, van Ginkel M, et al. Spectral reflectance indices as a potential indirect selection criteria for wheat yield under irrigation[J]. Crop Science, 2006, 46(2): 578-588. |
| [14] | 陈晨. 基于无人机图像的小麦生物量与产量的估测研究[D]. 扬州: 扬州大学, 2019. |
| CHEN Chen. Estimation of Wheat Biomass and Yield Based on UAV Images[D]. Yangzhou: Yangzhou University, 2019. | |
| [15] | Chen Y, Donohue R J, McVicar T R, et al. Nationwide crop yield estimation based on photosynthesis and meteorological stress indices[J]. Agricultural and Forest Meteorology, 2020, 284: 107872. |
| [16] | Chakrabarti S, Bongiovanni T, Judge J, et al. Assimilation of SMOS soil moisture for quantifying drought impacts on crop yield in agricultural regions[J]. IEEE Journal of Selected Topics in Applied Earth Observations and Remote Sensing, 2014, 7(9): 3867-3879. |
| [17] | Sakamoto T. Incorporating environmental variables into a MODIS-based crop yield estimation method for United States corn and soybeans through the use of a random forest regression algorithm[J]. ISPRS Journal of Photogrammetry and Remote Sensing, 2020, 160: 208-228. |
| [18] | 田明璐, 班松涛, 常庆瑞, 等. 基于无人机成像光谱仪数据的棉花叶绿素含量反演[J]. 农业机械学报, 2016, 47(11): 285-293. |
| TIAN Minglu, BAN Songtao, CHANG Qingrui, et al. Estimation of SPAD value of cotton leaf using hyperspectral images from UAV-based imaging spectroradiometer[J]. Transactions of the Chinese Society for Agricultural Machinery, 2016, 47(11): 285-293. | |
| [19] | 孟沌超. 基于无人机可见光影像的棉花氮素和叶绿素反演方法研究[D]. 淄博: 山东理工大学, 2021. |
| MENG Dunchao. Study on inversion method of cotton nitrogen and chlorophyll based on UAV visible light image[D]. Zibo: Shandong University of Technology, 2021. | |
| [20] | 刘小辉. 基于无人机影像的小麦叶绿素含量及产量定量反演研究[D]. 合肥: 安徽大学, 2019. |
| LIU Xiaohui. Inversion of Wheat Chlorophyll Content and Yield Based on Unmanned Aerial Vehicle Images[D]. Hefei: Anhui University, 2019. | |
| [21] | 邹楠, 杨文杰, 肖春华, 等. 种植密度对玉米冠层高光谱特征的响应研究[J]. 石河子大学学报(自然科学版), 2017, 35(6): 687-692. |
| ZOU Nan, YANG Wenjie, XIAO Chunhua, et al. Response of planting density to hyperspectral characteristics of maize canopy[J]. Journal of Shihezi University (Natural Science), 2017, 35(6): 687-692. |
| [1] | 郭文超, 贾尊尊, 丁新华, 叶晓琴, 付开赟, 吐尔逊·阿合买提, 王小武, 乔小燕, 孙建博. 新疆荒漠绿洲生态区亚洲玉米螟和欧洲玉米螟的种间竞争取代研究综述[J]. 新疆农业科学, 2024, 61(S1): 1-11. |
| [2] | 孙健博, 吴莉莉, 贾尊尊, 叶晓琴, 丁新华, 付开赟, 吐尔逊·阿合买提, 王哲, 李亚文, 付文君, 艾尔肯娜依·买买提江, 安尼瓦尔·库尔班, 郭文超. 新疆伊犁河谷玉米主要害虫田间一喷多防药效评价[J]. 新疆农业科学, 2024, 61(S1): 12-18. |
| [3] | 张帅, 高国文, 吴莉莉, 赵海燕, 王小武, 付开赟, 贾尊尊, 吐尔逊·阿合买提, 丁新华, 李克梅, 郭文超. 增效剂及微肥与种衣剂协同施用评价玉米茎腐病的防效[J]. 新疆农业科学, 2024, 61(S1): 19-27. |
| [4] | 戴爱梅, 叶梦迪, 丁志梅, 王志慧, 乔晓燕, 王小武, 付开赟, 贾尊尊, 叶晓琴, 吐尔逊·阿合买提, 康健, 丁新华, 郭文超. 不同苯唑氟草酮施药方式防除玉米田杂草药效及安全性评价[J]. 新疆农业科学, 2024, 61(S1): 28-34. |
| [5] | 袁梓涵, 赵雯慧, 王小武, 吐尔逊·阿合买提, 丁新华, 张帅, 付开赟, 贾尊尊, 郭文超. 玉米茎腐病生防菌的筛选及生防效果评价[J]. 新疆农业科学, 2024, 61(S1): 35-48. |
| [6] | 巩雪花, 王小武, 付开赟, 贾尊尊, 吐尔逊·阿合买提, 乔小燕, 叶晓琴, 郭文超, 丁新华. 新疆绿洲灌区玉米田杂草种子库及环境因子对杂草种子萌发的影响[J]. 新疆农业科学, 2024, 61(S1): 49-59. |
| [7] | 张磊, 孙诗仁, 谢小清, 王业建, 李冬, 唐怀君, 刘成. 额敏县玉米灌溉用水现状及节水灌溉策略[J]. 新疆农业科学, 2024, 61(S1): 81-84. |
| [8] | 杨明花, 廖必勇, 刘强, 彭云承, 达吾来·杰克山, 冯国瑞, 唐式敏. 鲜食糯玉米籽粒营养品质的差异变化分析[J]. 新疆农业科学, 2024, 61(9): 2087-2093. |
| [9] | 张泽华, 叶含春, 王振华, 李文昊, 李海强, 刘健. 等氮配施脲酶抑制剂对滴灌棉花生长发育和产量及品质的影响[J]. 新疆农业科学, 2024, 61(9): 2103-2111. |
| [10] | 陈瑞杰, 罗林毅, 阮向阳, 冶军. 腐植酸对滴灌棉田土壤养分和棉花产量及品质的影响[J]. 新疆农业科学, 2024, 61(9): 2112-2121. |
| [11] | 黄铂轩, 李鹏程, 郑苍松, 孙淼, 邵晶晶, 冯卫娜, 庞朝友, 徐文修, 董合林. 不同氮素抑制剂对棉花生长发育、氮素利用与产量的影响[J]. 新疆农业科学, 2024, 61(9): 2122-2131. |
| [12] | 张鸟, 王卉, 冯国郡, 再吐尼古丽·库尔班. 不同粒用高粱品种产量和农艺性状及品质的差异性分析[J]. 新疆农业科学, 2024, 61(9): 2160-2167. |
| [13] | 陈芳, 李字辉, 孙孝贵, 张庭军. 不同剂量的微生物菌剂对加工番茄产量及品质的影响[J]. 新疆农业科学, 2024, 61(9): 2285-2289. |
| [14] | 张承洁, 胡浩然, 段松江, 吴一帆, 张巨松. 氮肥与密度互作对海岛棉生长发育及产量和品质的影响[J]. 新疆农业科学, 2024, 61(8): 1821-1830. |
| [15] | 候丽丽, 王伟, 崔新菊, 周大伟. 有机无机肥配施对冬小麦产量和土壤养分及酶活性的影响[J]. 新疆农业科学, 2024, 61(8): 1845-1852. |
| 阅读次数 | ||||||||||||||||||||||||||||||||||||||||||||||||||
|
全文 52
|
|
|||||||||||||||||||||||||||||||||||||||||||||||||
|
摘要 267
|
|
|||||||||||||||||||||||||||||||||||||||||||||||||