
新疆农业科学 ›› 2023, Vol. 60 ›› Issue (6): 1308-1318.DOI: 10.6048/j.issn.1001-4330.2023.06.002
• 新疆主要粮食作物绿色丰产提质增效专栏 • 上一篇 下一篇
董德誉1( ), 程宇坤1, 王睿1, 雷钧杰2, 王伟1, 陈传信2, 张永强2, 耿洪伟1()
收稿日期:2022-10-30
出版日期:2023-06-20
发布日期:2023-06-20
通信作者:
耿洪伟(1978-),男,新疆库尔勒人,教授,博士,硕士生导师,研究方向为小麦遗传育种,(E-mail)hw-geng@163.com作者简介:董德誉(1995-),男,广西人,硕士研究生,研究方向为小麦遗传育种,(E-mail)deyudong@sina.com
基金资助:
DONG Deyu1(), CHENG Yukun1, WANG Rui1, LEI Junjie2, WANG Wei1, CHEN Chuanxin2, ZHENG Yongqiang2, GENG Hongwei1()
Received:2022-10-30
Published:2023-06-20
Online:2023-06-20
Supported by:摘要:
【目的】研究无人机多光谱影像对冬小麦光合作用实时监测的可行性,分析不同长势差异的冬小麦对估算模型的影响。【方法】选用16个冬小麦品种作为材料,在无氮处理N0(0 kg N/667m2)和正常施氮处理N1(15 kg N/667m2)下获得孕穗期、开花期和灌浆期无人机蓝(B)、绿(G)、红(R)、红边(RE)和近红外(NIR)5个波段的光谱遥感影像,结合同时期4种光合参数胞间CO2浓度(Ci)、气孔导度(Gs)、净光合速率(Pn)和蒸腾速率(Ti),采用梯度增强回归和岭回归方法建立正常施氮处理下开花期和全生育期4个光合参数的估算模型,并用该估算模型估算无氮处理下开花期和全生育期4个光合参数。【结果】梯度增强回归可以较好的预测施氮下开花期净光合速率(Pn),决定系数(R2)为0.82,Ci、Gs和Ti的预测反演精度分别为0.44、0.64和0.48,在无氮处理下,该模型估算精度大于0.5的为Pn、Gs和Ti。【结论】岭回归在估算正常施氮下全生育期的4个光合参数时,R2 > 0.5的是Pn、Gs和Ti,而在无氮处理水平下,该估算模型的预测决定系数R2 > 0.5的是Gs和Pn。对不同生育期的小麦光合参数的实时监测,可以通过无人机多光谱影像获取的植被指数结合梯度增强回归和岭回归方法来实现。
中图分类号:
董德誉, 程宇坤, 王睿, 雷钧杰, 王伟, 陈传信, 张永强, 耿洪伟. 基于无人机多光谱影像反演不同生育期小麦光合参数分析[J]. 新疆农业科学, 2023, 60(6): 1308-1318.
DONG Deyu, CHENG Yukun, WANG Rui, LEI Junjie, WANG Wei, CHEN Chuanxin, ZHENG Yongqiang, GENG Hongwei. Retrieval of wheat photosynthetic parameters at different growth stages based on UAV multispectral images[J]. Xinjiang Agricultural Sciences, 2023, 60(6): 1308-1318.
| 编号 Number | 品种名称 Variety | 编号 Number | 品种名称 Variety |
|---|---|---|---|
| 1 | 石新633 | 9 | 新冬46号 |
| 2 | 新冬17号 | 10 | 新冬48号 |
| 3 | 新冬18号 | 11 | 新冬50号 |
| 4 | 新冬22号 | 12 | 新冬51号 |
| 5 | 新冬36号 | 13 | 新冬52号 |
| 6 | 新冬37号 | 14 | 新冬53号 |
| 7 | 新冬38号 | 15 | 新粮201 |
| 8 | 新冬41号 | 16 | 新冬60号 |
表1 研究选用的小麦品种
Tab.1 Wheat cultivars used in this study
| 编号 Number | 品种名称 Variety | 编号 Number | 品种名称 Variety |
|---|---|---|---|
| 1 | 石新633 | 9 | 新冬46号 |
| 2 | 新冬17号 | 10 | 新冬48号 |
| 3 | 新冬18号 | 11 | 新冬50号 |
| 4 | 新冬22号 | 12 | 新冬51号 |
| 5 | 新冬36号 | 13 | 新冬52号 |
| 6 | 新冬37号 | 14 | 新冬53号 |
| 7 | 新冬38号 | 15 | 新粮201 |
| 8 | 新冬41号 | 16 | 新冬60号 |
| 施氮时期 N stages | 基肥 Basal nutrition | 起身期 Rising stage | 拔节期 Jointing stage | 孕穗期 Booting stage |
|---|---|---|---|---|
| 施肥比例Fertilization ratio(%) | 40 | 10 | 40 | 10 |
| 施尿素量 Urea application amount(kg/667m2) | 13.00 | 3.26 | 13.00 | 3.26 |
表2 滴灌小麦不同施氮肥总量及不同时期追氮量
Tab.2 Total nitrogen fertilizer amount and nitrogen application amount at different stages of drip irrigation for wheat (kg/667m2)
| 施氮时期 N stages | 基肥 Basal nutrition | 起身期 Rising stage | 拔节期 Jointing stage | 孕穗期 Booting stage |
|---|---|---|---|---|
| 施肥比例Fertilization ratio(%) | 40 | 10 | 40 | 10 |
| 施尿素量 Urea application amount(kg/667m2) | 13.00 | 3.26 | 13.00 | 3.26 |
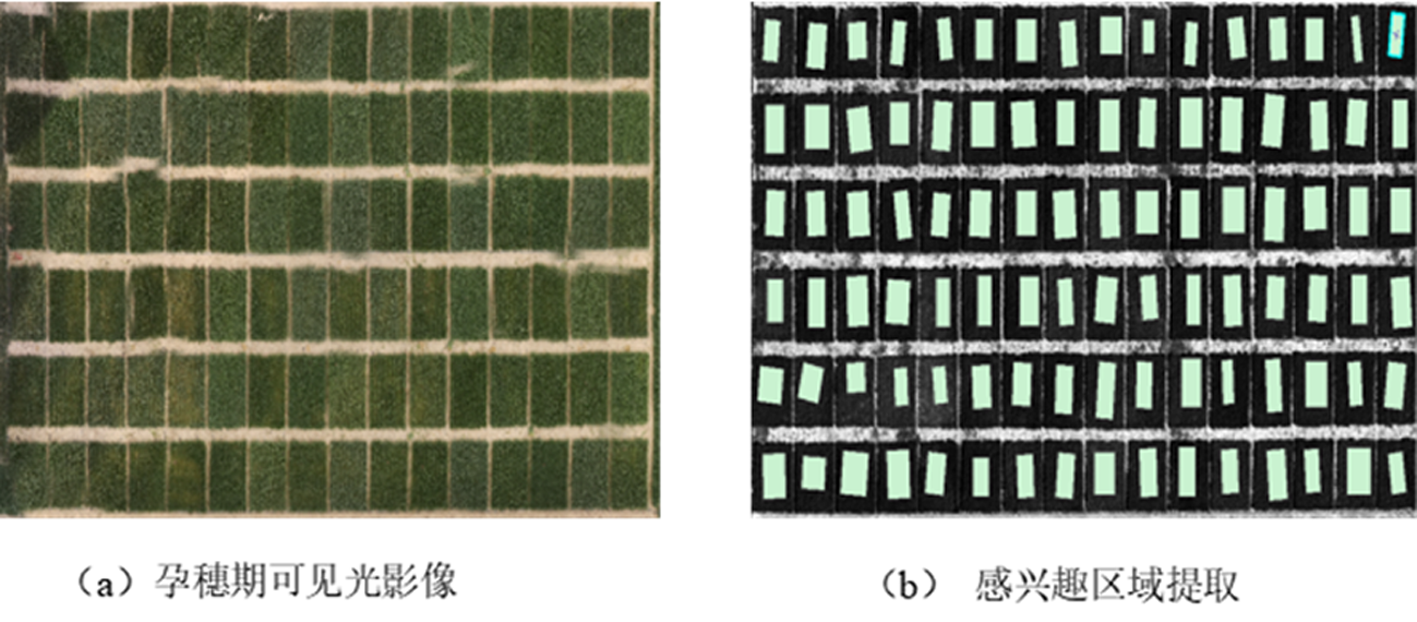
图1 田间试验设计
Fig.1 Field test design
| 参数 Parameter | 参数值 Parameter values |
|---|---|
| 飞行高度Altitude | 12 m |
| 飞行速度Speed | 5.4 km/h |
| 航向重叠率Course overlap ratio | 75% |
| 旁向重叠率Lateral overlap rate | 75% |
| 光谱类型Spectral types | R、G、B、RE、NIR |
表3 无人机多光谱影像获取时参数
Tab.3 Parameters of uav multispectral image acquisition
| 参数 Parameter | 参数值 Parameter values |
|---|---|
| 飞行高度Altitude | 12 m |
| 飞行速度Speed | 5.4 km/h |
| 航向重叠率Course overlap ratio | 75% |
| 旁向重叠率Lateral overlap rate | 75% |
| 光谱类型Spectral types | R、G、B、RE、NIR |
| 植被指数 Vegetation index | 计算公式 Formula to calculate |
|---|---|
| 归一化植被指数(NDVI)[ | (ρNIR-ρR)/(ρNIR+ρR) |
| 绿色归一化植被指数(GNDVI)[ | (ρNIR-ρG)/(ρNIR+ρG) |
| 归一化绿蓝差指数(NGBDI)[ | (ρG-ρB)/(ρG+ρB) |
| 归一化绿红差指数(NGRDI)[ | (ρG-ρR)/(ρG+ρR) |
| 红边重归一化植被指数(RERDVI)[ | (ρNIR-ρRE)/(ρNIR+ρRE) |
| 土壤调节植被指数(SAVI)[ | 2.5(ρNIR-ρR)/(ρNIR+ρR+0.5) |
| 绿波段优化土壤调节植被指数(GOSAVI)[ | 1.16[(ρNIR-ρG)/(ρNIR+ρG+0.16)] |
| 红边优化土壤调节植被指数(REOSAVI)[ | 1.16[(ρNIR-ρR)/(ρNIR+ρR+0.16)] |
| 优化土壤调节植被指数(OSAVI)[ | (ρNIR-ρR)/(ρNIR+ρR+0.16) |
| 比值植被指数(RVI)[ | ρNIR/ρR |
| 差值植被指数(DVI)[ | ρNIR-ρR |
| 绿波段比值植被指数(GRVI)[ | ρNIR/ρG |
| 过绿指数(EXG)[ | 2ρG-ρR-ρB |
| 三角植被指数(TVI)[ | 0.5[120(ρNIR-ρG)-200(ρR-ρG) |
| 叶绿素吸收比值植被指数(CARI)[ | (ρRE-ρR)-0.2(ρRE+ρR) |
| 绿波段大气阻抗植被指数(VARIgreen)[ | (ρG-ρR)/(ρG+ρR-ρB) |
| 红波段大气阻抗植被指数(VARIred)[ | (ρRE-1.7ρR+0.7ρB)/(ρRE+2.3ρR-1.3ρB) |
| 增强型植被指数(EVI)[ | 2.5(ρNIR-ρR)/(ρNIR+6ρR-7.5ρB+1) |
表4 植被指数
Tab.4 Vegetation index
| 植被指数 Vegetation index | 计算公式 Formula to calculate |
|---|---|
| 归一化植被指数(NDVI)[ | (ρNIR-ρR)/(ρNIR+ρR) |
| 绿色归一化植被指数(GNDVI)[ | (ρNIR-ρG)/(ρNIR+ρG) |
| 归一化绿蓝差指数(NGBDI)[ | (ρG-ρB)/(ρG+ρB) |
| 归一化绿红差指数(NGRDI)[ | (ρG-ρR)/(ρG+ρR) |
| 红边重归一化植被指数(RERDVI)[ | (ρNIR-ρRE)/(ρNIR+ρRE) |
| 土壤调节植被指数(SAVI)[ | 2.5(ρNIR-ρR)/(ρNIR+ρR+0.5) |
| 绿波段优化土壤调节植被指数(GOSAVI)[ | 1.16[(ρNIR-ρG)/(ρNIR+ρG+0.16)] |
| 红边优化土壤调节植被指数(REOSAVI)[ | 1.16[(ρNIR-ρR)/(ρNIR+ρR+0.16)] |
| 优化土壤调节植被指数(OSAVI)[ | (ρNIR-ρR)/(ρNIR+ρR+0.16) |
| 比值植被指数(RVI)[ | ρNIR/ρR |
| 差值植被指数(DVI)[ | ρNIR-ρR |
| 绿波段比值植被指数(GRVI)[ | ρNIR/ρG |
| 过绿指数(EXG)[ | 2ρG-ρR-ρB |
| 三角植被指数(TVI)[ | 0.5[120(ρNIR-ρG)-200(ρR-ρG) |
| 叶绿素吸收比值植被指数(CARI)[ | (ρRE-ρR)-0.2(ρRE+ρR) |
| 绿波段大气阻抗植被指数(VARIgreen)[ | (ρG-ρR)/(ρG+ρR-ρB) |
| 红波段大气阻抗植被指数(VARIred)[ | (ρRE-1.7ρR+0.7ρB)/(ρRE+2.3ρR-1.3ρB) |
| 增强型植被指数(EVI)[ | 2.5(ρNIR-ρR)/(ρNIR+6ρR-7.5ρB+1) |

图2 不同氮素处理下各小麦品种4种光合参数的变化 注:N0和N1分别表示无氮处理水平N0(0 kg N/667m2)和正常施氮处理水平N1(15 kg N/667m2)
Fig 2 Changes of four photosynthetic parameters of wheat varieties under different nitrogen treatments Note:N0 and N1 respectively represent nitrogen free treatment levels N0(0 kg N/667m2) and normal nitrogen application level N1(15 kg N/667m2)
| 植被指数 Vegetation index | N1开花期 N1 Flowering stage | N0开花期 N0 Flowering stage | ||||||
|---|---|---|---|---|---|---|---|---|
| 胞间CO2 浓度(Ci) | 气孔 导度 (Gs) | 净光 合速率 (Pn) | 蒸腾 速率 (Ti) | 胞间CO2 浓度(Ci) | 气孔 导度 (Gs) | 净光 合速率 (Pn) | 蒸腾 速率 (Ti) | |
| 叶绿素吸收比值指数CARI | -0.01 | -0.48 | -0.56* | -0.51* | -0.05 | 0.16 | 0.42 | -0.14 |
| 差值植被指数DVI | 0.06 | -0.10 | -0.13 | -0.09 | -0.12 | 0.09 | 0.51* | -0.24 |
| 增强型植被指数EVI | 0.02 | -0.23 | -0.32 | -0.26 | 0.24 | 0.06 | 0.55* | 0.08 |
| 过绿指数EXG | 0.43 | 0.29 | 0.11 | 0.16 | -0.14 | 0.42 | 0.39 | -0.14 |
| 绿色归一化植被指数GNDVI | -0.41 | -0.6 | -0.59* | -0.59* | 0.05 | -0.15 | 0.34 | -0.11 |
| 绿波段优化土壤调节植被指数GOSAVI | -0.41 | -0.68** | -0.60* | -0.59* | 0.04 | -0.14 | 0.36 | -0.13 |
| 绿波段比值植被指数GRVI | -0.33 | -0.69** | -0.64** | -0.61* | 0.01 | -0.07 | 0.45 | -0.05 |
| 归一化绿红差异指数NGRGI | 0.23 | -0.07 | -0.23 | -0.16 | 0.14 | 0.20 | 0.52* | 0.20 |
| 归一化植被指数NDVI | -0.09 | -0.41 | -0.47 | -0.42 | 0.16 | 0.01 | 0.57* | -0.08 |
| 归一化蓝绿差异指数NGBDI | -0.01 | -0.52* | -0.55* | -0.52* | -0.33 | -0.07 | 0.28 | -0.33 |
| 优化土壤调节植被指数OSAVI | 0.38 | 0.85** | 0.79** | 0.80** | 0.04 | 0.09 | -0.27 | 0.15 |
| 绿波段优化土壤调节植被指数REOSAVI | -0.09 | -0.39 | -0.44 | -0.40 | 0.15 | 0.02 | 0.56* | -0.08 |
| 红边重归一化植被指数RERDVI | -0.07 | 0.49 | 0.59* | 0.54* | 0.23 | -0.14 | 0.20 | -0.10 |
| 比值植被指数RVI | 0.05 | -0.31 | -0.41 | -0.35 | 0.10 | -0.01 | 0.63** | 0.09 |
| 土壤调节植被指数SAVI | -0.10 | -0.40 | -0.45 | -0.41 | 0.17 | 0.01 | 0.57* | -0.09 |
| 三角植被指数TVI | 0.09 | -0.10 | -0.15 | -0.11 | -0.09 | 0.13 | 0.55* | -0.23 |
| 绿波段大气阻抗植被指数VARIgreen | 0.21 | -0.04 | -0.18 | -0.12 | 0.23 | 0.16 | 0.53* | 0.09 |
| 红波段大气阻抗植被指数VARIred | -0.03 | -0.45 | -0.53* | -0.47 | 0.11 | 0.09 | 0.50 | 0.06 |
表5 开花期植被指数和光合参数的相关系数
Tab.5 Correlation coefficient between vegetation index and photosynthetic parameters at flowering stage
| 植被指数 Vegetation index | N1开花期 N1 Flowering stage | N0开花期 N0 Flowering stage | ||||||
|---|---|---|---|---|---|---|---|---|
| 胞间CO2 浓度(Ci) | 气孔 导度 (Gs) | 净光 合速率 (Pn) | 蒸腾 速率 (Ti) | 胞间CO2 浓度(Ci) | 气孔 导度 (Gs) | 净光 合速率 (Pn) | 蒸腾 速率 (Ti) | |
| 叶绿素吸收比值指数CARI | -0.01 | -0.48 | -0.56* | -0.51* | -0.05 | 0.16 | 0.42 | -0.14 |
| 差值植被指数DVI | 0.06 | -0.10 | -0.13 | -0.09 | -0.12 | 0.09 | 0.51* | -0.24 |
| 增强型植被指数EVI | 0.02 | -0.23 | -0.32 | -0.26 | 0.24 | 0.06 | 0.55* | 0.08 |
| 过绿指数EXG | 0.43 | 0.29 | 0.11 | 0.16 | -0.14 | 0.42 | 0.39 | -0.14 |
| 绿色归一化植被指数GNDVI | -0.41 | -0.6 | -0.59* | -0.59* | 0.05 | -0.15 | 0.34 | -0.11 |
| 绿波段优化土壤调节植被指数GOSAVI | -0.41 | -0.68** | -0.60* | -0.59* | 0.04 | -0.14 | 0.36 | -0.13 |
| 绿波段比值植被指数GRVI | -0.33 | -0.69** | -0.64** | -0.61* | 0.01 | -0.07 | 0.45 | -0.05 |
| 归一化绿红差异指数NGRGI | 0.23 | -0.07 | -0.23 | -0.16 | 0.14 | 0.20 | 0.52* | 0.20 |
| 归一化植被指数NDVI | -0.09 | -0.41 | -0.47 | -0.42 | 0.16 | 0.01 | 0.57* | -0.08 |
| 归一化蓝绿差异指数NGBDI | -0.01 | -0.52* | -0.55* | -0.52* | -0.33 | -0.07 | 0.28 | -0.33 |
| 优化土壤调节植被指数OSAVI | 0.38 | 0.85** | 0.79** | 0.80** | 0.04 | 0.09 | -0.27 | 0.15 |
| 绿波段优化土壤调节植被指数REOSAVI | -0.09 | -0.39 | -0.44 | -0.40 | 0.15 | 0.02 | 0.56* | -0.08 |
| 红边重归一化植被指数RERDVI | -0.07 | 0.49 | 0.59* | 0.54* | 0.23 | -0.14 | 0.20 | -0.10 |
| 比值植被指数RVI | 0.05 | -0.31 | -0.41 | -0.35 | 0.10 | -0.01 | 0.63** | 0.09 |
| 土壤调节植被指数SAVI | -0.10 | -0.40 | -0.45 | -0.41 | 0.17 | 0.01 | 0.57* | -0.09 |
| 三角植被指数TVI | 0.09 | -0.10 | -0.15 | -0.11 | -0.09 | 0.13 | 0.55* | -0.23 |
| 绿波段大气阻抗植被指数VARIgreen | 0.21 | -0.04 | -0.18 | -0.12 | 0.23 | 0.16 | 0.53* | 0.09 |
| 红波段大气阻抗植被指数VARIred | -0.03 | -0.45 | -0.53* | -0.47 | 0.11 | 0.09 | 0.50 | 0.06 |
| 植被指数 Vegetation index | N1全生育期 N1 The whole growth period | N0全生育期 N0 The whole growth period | ||||||
|---|---|---|---|---|---|---|---|---|
| 胞间CO2 浓度(Ci) | 气孔 导度 (Gs) | 净光合 速率 (Pn) | 蒸腾 速率 (Ti) | 胞间CO2 浓度(Ci) | 气孔 导度 (Gs) | 净光合 速率 (Pn) | 蒸腾 速率 (Ti) | |
| 叶绿素吸收比值指数CARI | -0.34** | -0.05 | 0.21 | 0.48** | -0.37** | -0.32** | -0.07 | 0.23* |
| 差值植被指数DVI | -0.40** | 0.13 | 0.41** | 0.62** | -0.40** | -0.23* | 0.04 | 0.24* |
| 增强型植被指数EVI | -0.37** | 0.16 | 0.40** | 0.52** | -0.29** | -0.14 | 0.09 | 0.34** |
| 过绿指数EXG | 0.11 | -0.49** | -0.41** | -0.02 | -0.16 | -0.48** | -0.43** | 0.04 |
| 绿色归一化植被指数GNDVI | -0.43** | 0.49** | 0.67** | 0.54** | -0.18 | 0.24* | 0.41** | 0.24* |
| 绿波段优化土壤调节植被指数GOSAVI | -0.43** | 0.48** | 0.66** | 0.54** | -0.19 | 0.24* | 0.41** | 0.24* |
| 绿波段比值植被指数GRVI | -0.42** | 0.39** | 0.59** | 0.51** | -0.22 | 0.16 | 0.35** | 0.24* |
| 归一化绿红差异指数NGRGI | -0.17 | -0.18 | 0.02 | 0.28* | -0.26* | -0.37** | -0.21 | 0.24* |
| 归一化植被指数NDVI | -0.41** | 0.2 | 0.45** | 0.56** | -0.31** | -0.09 | 0.14 | 0.31** |
| 归一化蓝绿差异指数NGBDI | 0.28* | -0.25* | -0.43** | -0.55** | 0.19 | 0.03 | -0.17 | -0.18 |
| 优化土壤调节植被指数OSAVI | -0.41** | 0.2 | 0.46** | 0.56** | -0.31** | -0.09 | 0.14 | 0.31** |
| 绿波段优化土壤调节植被指数REOSAVI | -0.41** | 0.2 | 0.45** | 0.56** | -0.30** | -0.09 | 0.14 | 0.31** |
| 红边重归一化植被指数RERDVI | -0.19 | 0.54** | 0.58** | 0.30** | 0.08 | 0.52** | 0.54** | 0.16 |
| 比值植被指数RVI | -0.33** | 0.13 | 0.35** | 0.44** | -0.26* | -0.13 | 0.08 | 0.31** |
| 土壤调节植被指数SAVI | -0.41** | 0.2 | 0.45** | 0.56** | -0.31** | -0.09 | 0.14 | 0.31** |
| 三角植被指数TVI | -0.38** | 0.08 | 0.36** | 0.59** | -0.39** | -0.26* | 0.01 | 0.25* |
| 绿波段大气阻抗植被指数VARIgreen | -0.17 | -0.17 | 0.03 | 0.28* | -0.25* | -0.36** | -0.2 | 0.25* |
| 红波段大气阻抗植被指数VARIred | -0.34** | -0.01 | 0.25* | 0.46** | -0.35** | -0.29** | -0.05 | 0.30** |
表6 全生育期植被指数和光合参数的相关系数
Tab.6 Correlation coefficient between vegetation index and photosynthetic parameters in whole growth period
| 植被指数 Vegetation index | N1全生育期 N1 The whole growth period | N0全生育期 N0 The whole growth period | ||||||
|---|---|---|---|---|---|---|---|---|
| 胞间CO2 浓度(Ci) | 气孔 导度 (Gs) | 净光合 速率 (Pn) | 蒸腾 速率 (Ti) | 胞间CO2 浓度(Ci) | 气孔 导度 (Gs) | 净光合 速率 (Pn) | 蒸腾 速率 (Ti) | |
| 叶绿素吸收比值指数CARI | -0.34** | -0.05 | 0.21 | 0.48** | -0.37** | -0.32** | -0.07 | 0.23* |
| 差值植被指数DVI | -0.40** | 0.13 | 0.41** | 0.62** | -0.40** | -0.23* | 0.04 | 0.24* |
| 增强型植被指数EVI | -0.37** | 0.16 | 0.40** | 0.52** | -0.29** | -0.14 | 0.09 | 0.34** |
| 过绿指数EXG | 0.11 | -0.49** | -0.41** | -0.02 | -0.16 | -0.48** | -0.43** | 0.04 |
| 绿色归一化植被指数GNDVI | -0.43** | 0.49** | 0.67** | 0.54** | -0.18 | 0.24* | 0.41** | 0.24* |
| 绿波段优化土壤调节植被指数GOSAVI | -0.43** | 0.48** | 0.66** | 0.54** | -0.19 | 0.24* | 0.41** | 0.24* |
| 绿波段比值植被指数GRVI | -0.42** | 0.39** | 0.59** | 0.51** | -0.22 | 0.16 | 0.35** | 0.24* |
| 归一化绿红差异指数NGRGI | -0.17 | -0.18 | 0.02 | 0.28* | -0.26* | -0.37** | -0.21 | 0.24* |
| 归一化植被指数NDVI | -0.41** | 0.2 | 0.45** | 0.56** | -0.31** | -0.09 | 0.14 | 0.31** |
| 归一化蓝绿差异指数NGBDI | 0.28* | -0.25* | -0.43** | -0.55** | 0.19 | 0.03 | -0.17 | -0.18 |
| 优化土壤调节植被指数OSAVI | -0.41** | 0.2 | 0.46** | 0.56** | -0.31** | -0.09 | 0.14 | 0.31** |
| 绿波段优化土壤调节植被指数REOSAVI | -0.41** | 0.2 | 0.45** | 0.56** | -0.30** | -0.09 | 0.14 | 0.31** |
| 红边重归一化植被指数RERDVI | -0.19 | 0.54** | 0.58** | 0.30** | 0.08 | 0.52** | 0.54** | 0.16 |
| 比值植被指数RVI | -0.33** | 0.13 | 0.35** | 0.44** | -0.26* | -0.13 | 0.08 | 0.31** |
| 土壤调节植被指数SAVI | -0.41** | 0.2 | 0.45** | 0.56** | -0.31** | -0.09 | 0.14 | 0.31** |
| 三角植被指数TVI | -0.38** | 0.08 | 0.36** | 0.59** | -0.39** | -0.26* | 0.01 | 0.25* |
| 绿波段大气阻抗植被指数VARIgreen | -0.17 | -0.17 | 0.03 | 0.28* | -0.25* | -0.36** | -0.2 | 0.25* |
| 红波段大气阻抗植被指数VARIred | -0.34** | -0.01 | 0.25* | 0.46** | -0.35** | -0.29** | -0.05 | 0.30** |
| 开花期Flowering stage | 全生育期The whole growth period | ||||||
|---|---|---|---|---|---|---|---|
| Ci | Gs | Pn | Ti | Ci | Gs | Pn | Ti |
| EVI | CARI | GRVI | CARI | CARI | EXG | EXG | EVI |
| EXG | EXG | NDVI | GNDVI | DVI | GNDVI | GNDVI | NDVI |
| NGBDI | GNDVI | REOSAVI | GOSAVI | NDVI | GOSAVI | GOSAVI | OSAVI |
| NGRDI | GOSAVI | RVI | NGBDI | TVI | GRVI | GRVI | RVI |
| VARIgreen | VARIgreen | SAVI | OSAVI | VARIred | RERDVI | RERDVI | SAVI |
表7 不同光合参数用于数据建模的植被指数
Tab.7 Vegetation indices with different photosynthetic parameters for data modeling
| 开花期Flowering stage | 全生育期The whole growth period | ||||||
|---|---|---|---|---|---|---|---|
| Ci | Gs | Pn | Ti | Ci | Gs | Pn | Ti |
| EVI | CARI | GRVI | CARI | CARI | EXG | EXG | EVI |
| EXG | EXG | NDVI | GNDVI | DVI | GNDVI | GNDVI | NDVI |
| NGBDI | GNDVI | REOSAVI | GOSAVI | NDVI | GOSAVI | GOSAVI | OSAVI |
| NGRDI | GOSAVI | RVI | NGBDI | TVI | GRVI | GRVI | RVI |
| VARIgreen | VARIgreen | SAVI | OSAVI | VARIred | RERDVI | RERDVI | SAVI |
| 光合参数 Photosynthetic parameters | N1开花期 N1 Flowering stage | N0开花期 N0 Flowering stage | N1全生育期 N1 The whole growth period | N0全生育期 N0 The whole growth period | ||||||||
|---|---|---|---|---|---|---|---|---|---|---|---|---|
| R2 | RMSE | RE | R2 | RMSE | RE | R2 | RMSE | RE | R2 | RMSE | RE | |
| Ci (μmol/(m2·s)) | 0.44 | 31.87 | 0.12 | 0.39 | 21.933 | 0.08 | 0.22 | 17.3 | 0.06 | 0.47 | 17.85 | 0.06 |
| Gs (mol/(m2·s)) | 0.64 | 55.31 | 0.26 | 0.78 | 80.74 | 0.3 | 0.57 | 61.51 | 0.24 | 0.62 | 70.94 | 0.29 |
| Pn (mol/(m2·s)) | 0.82 | 5.23 | 0.26 | 0.78 | 4.99 | 0.2 | 0.74 | 3.59 | 0.18 | 0.54 | 4.39 | 0.23 |
| Ti (μmol/(m2·s)) | 0.48 | 0.88 | 0.14 | 0.8 | 0.9 | 0.13 | 0.54 | 0.8 | 0.16 | 0.16 | 1.14 | 0.28 |
表8 不同生长势差异的小麦光合参数对模型影响
Tab.8 Effects of wheat photosynthetic parameters with different growth potential differences on the model
| 光合参数 Photosynthetic parameters | N1开花期 N1 Flowering stage | N0开花期 N0 Flowering stage | N1全生育期 N1 The whole growth period | N0全生育期 N0 The whole growth period | ||||||||
|---|---|---|---|---|---|---|---|---|---|---|---|---|
| R2 | RMSE | RE | R2 | RMSE | RE | R2 | RMSE | RE | R2 | RMSE | RE | |
| Ci (μmol/(m2·s)) | 0.44 | 31.87 | 0.12 | 0.39 | 21.933 | 0.08 | 0.22 | 17.3 | 0.06 | 0.47 | 17.85 | 0.06 |
| Gs (mol/(m2·s)) | 0.64 | 55.31 | 0.26 | 0.78 | 80.74 | 0.3 | 0.57 | 61.51 | 0.24 | 0.62 | 70.94 | 0.29 |
| Pn (mol/(m2·s)) | 0.82 | 5.23 | 0.26 | 0.78 | 4.99 | 0.2 | 0.74 | 3.59 | 0.18 | 0.54 | 4.39 | 0.23 |
| Ti (μmol/(m2·s)) | 0.48 | 0.88 | 0.14 | 0.8 | 0.9 | 0.13 | 0.54 | 0.8 | 0.16 | 0.16 | 1.14 | 0.28 |
| [1] |
Curtis T, Halford N G. Food security: the challenge of increasing wheat yield and the importance of not compromising food safety[J]. Annals of Applied Biology, 2014, 164(3):354-372.
PMID |
| [2] | 吴舒, 穆月英, 聂凤英. 中国小麦生产波动成因及产量预测[J]. 农业展望, 2020, 16(6): 40-47,58. |
| WU Shu, MU Yueying, NIE Fenying. Influencing Factors and Forecast of China's Wheat Production Fluctuations[J]. Agricultural Outlook, 2020, 16(6): 40-47,58. | |
| [3] | 张其德. 光合作用的光反应[J]. 植物杂志, 2000,(5):2. |
| ZHANG Qide. The light reaction of photosynthesis[J]. Plants, 2000,(5): 2. | |
| [4] | 蒋高明. LI-6400光合作用测定系统: 原理、性能、基本操作与常见故障的排除[J]. 植物学通报, 1996,(S1): 74-78. |
| JIANG Gaoming. LI-6400 Portable photosyntheses system: principle, function, basic, operation and main problems and solutions during measurement[J]. Chinese Bulletin of Botany, 1996,(S1): 74-78. | |
| [5] | 张雨晴, 于海业, 刘爽, 等. 玉米叶片净光合速率快速检测方法研究[J]. 农机化研究, 2019, 41(4): 182-185. |
| ZHANG Yuqing, YU Haiying, LIU Shuan, et al. Study on Rapid Detection Method of Net Photosynthetic Rate of Maize Leaves[J]. Journal of Agricultural Mechanization Research, 2019, 41(4): 182-185. | |
| [6] |
Korres N E, Froud-Williams R J, Moss S R. Chlorophyll fluorescence technique as a rapid diagnostic test of the effects of the photosynthetic inhibitor chlorotoluron on two winter wheat cultivars[J]. Annals of Applied Biology, 2003, 143(1): 53-56.
DOI URL |
| [7] | 刘慎彬. 基于多角度日光诱导叶绿素荧光估算水稻光能利用率[D]. 南京: 南京信息工程大学, 2020. |
| LIU Shenbin. Estimation of light use efficiency of rice based on multi-angle solar-induced chlorophyll fluorescence[D]. Nanjing: Nanjing University of Information Science and Technology, 2020. | |
| [8] |
刘玉梅, 王云诚, 于贤昌, 等. 黄瓜单叶净光合速率对二氧化碳浓度、温度和光照强度响应模型[J]. 应用生态学报, 2007,(4): 883-887.
PMID |
|
LIU Yumei, WANG Yunchen, YU Xianchan, et al. Mathematic m ode ls of cucumber net photosynthesis rate respond ing to CO2 concentration, temperature, and illum ination intensity[J]. Chinese Journal of Applied Ecology, 2007,(4): 883-887.
PMID |
|
| [9] | Gamon J A, Kovalchuk O, Wong C, et al. Monitoring seasonal and diurnal changes in photosynthetic pigments with automated PRI and NDVI sensors[J]. Biogeosciences, 2015, 12(3): 2947-2978. |
| [10] |
Albert P C, Esa T, Jon A, et al. Linking chlorophyll a fluorescence to photosynthesis for remote sensing applications: mechanisms and challenges[J]. Journal of Experimental Botany, 2014, 65(15): 4065-4095.
DOI URL |
| [11] | Ian B S, Elizabeth P, Clare S, et al. Use of hyperspectral remote sensing to estimate the gross photosynthesis of agricultural fields[J]. Canadian Journal of Remote Sensing, 2014, 34(3): 333-341. |
| [12] | 王娣, 佃袁勇, 乐源, 等. 基于高光谱植被指数的叶片净光合速率Pn反演[J]. 地理与地理信息科学, 2016, 32(4): 42-48. |
| WANG Di, DIAN Yuanyong, LE Yuan, et al. Net Photosynthetic Rata Inversion Based on Hyperspectral Vegetation Indices[J]. Geography and Geo-Information Science, 2016, 32(4): 42-48. | |
| [13] | 苗梦珂, 王宝山, 李长春, 等. 基于连续小波变换的冬小麦叶片最大净光合速率遥感估算[J]. 江苏农业学报, 2020, 36(3): 544-552. |
| MIAO Mengkai, WANG Baoshang, LI Changchun, et al. Remote sensing estimation of maximum net photosynthetic rate of winter wheat leaves based on continuous wavelet transform[J]. Jiangsu Journal of Agricultural Sciences, 2020, 36(3): 544-552. | |
| [14] |
Nz A, Mw B, Ning W A. Precision agriculture—a worldwide overview[J]. Computers and Electronics in Agriculture, 2002, 36(2-3): 113-132.
DOI URL |
| [15] |
Monika R, Behara S, Viviana O, et al. The advantages of using drones over space-borne imagery in the mapping of mangrove forests[J]. Plos One, 2018, 13(7): e0200288.
DOI URL |
| [16] | 陈俊英, 陈硕博, 张智韬, 等. 无人机多光谱遥感反演花蕾期棉花光合参数研究[J]. 农业机械学报, 2018, 49(10): 230-239. |
| CHEN Junying, CHEN Shuobo, ZHANG Zhitao. Investigation on Photosynthetic Parameters of Cotton during Budding Period by Multi-spectral Remote Sensing of Unmanned Aerial Vehicle[J]. Transactions of the Chinese Society for Agricultural Machinery, 2018, 49(10): 230-239. | |
| [17] | Rouse J W, Haas R W, Schell J A, et al. Monitoring the vernal advancement and retrogradation (green wave effect) of natural vegetation[J]. Greenbelt, MD: NASA/GSFC Type III, Final Report. 1974. |
| [18] |
Hunt E R, Cavigelli M, Daughtry C, et al. Evaluation of Digital Photography from Model Aircraft for Remote Sensing of Crop Biomass and Nitrogen Status[J]. Precision Agriculture, 2005, 6(4): 359-378.
DOI URL |
| [19] | Kim M S, Daughtry C S T, Chappelle E W, et al. The use of high spectral resolution bands for estimating absorbed photosynthetically active radiation.ISPRS sixth international colloquium on physical measurements and signatures in remote sensing, Val d'Isère, France, 17-21. |
| [20] | Huete A R. A soil-adjusted vegetation index (SAVI)[J]. Remote Sensing of Environment, 1988,(25): 295-309. |
| [21] | Pearson R L, Miller L D. Remote Mapping of Standing Crop Biomass for Estimation of Productivity of the Shortgrass Prairie[J]. Remote Sensing of Environment, 1972. |
| [22] |
Torres-Sánchez J, Peña J M, De-Castro A I, et al. Multi-temporal mapping of the vegetation fraction in early-season wheat fields using images from UAV[J]. Computers and Electronics in Agriculture, 2014, 103: 104-113.
DOI URL |
| [23] |
Broge N H, Leblanc E. Comparing prediction power and stability of broadband and hyperspectral vegetation indices for estimation of green leaf area index and canopy chlorophyll density[J]. Remote Sensing of Environment, 2001, 76(2): 156-172.
DOI URL |
| [24] |
Chen Y Z, Murchie E H, Hubbart S, et al. Effects of season-dependent irradiance levels and nitrogen-deficiency on photosynthesis and photoinhibition in field-grown rice (Oryza sativa)[J]. Physiologia plantarum, 2003, 117(3): 343-351.
DOI URL |
| [25] | 张岁岐, 山仑. 土壤干旱条件下氮素营养对玉米内源激素含量影响[J]. 应用生态学报, 2003,(9): 1503-1506. |
| ZHANG Shuiqi, SHAN Lun. Effeet of nitrogen nutrition on endogenous hormone content of maize under soil drought conditions[J]. Chinese Journal of Applied Ecology, 2003,(9): 1503-1506. | |
| [26] | Evans J R, Seemann J R. The allocation of protein nitrogen in the photosynthetic apparatus: costs, consequences, and control[J]. Plant Biology, 1989,(1): 183-205. |
| [27] | Grassi G, Meir P, Cromer R, et al. Photosynthetic parameters in seedlings of Eucalyptus grandis as affected by rate of nitrogen supply[J]. Plant Cell & Environment, 2010, 25(12): 1677-1688. |
| [28] | 孙小妹, 张涛, 陈年来, 等. 土壤水分和氮素对春小麦叶片抗氧化系统的影响[J]. 干旱区研究, 2011, 28(2): 205-214. |
| Sun Xiaomei, Zhang Tao, Chen Nianlai, et al. Study on Antioxygenic System in Leaves of Three Spring Wheat Cultivars with Different Drought-resistant Capabilities under Different Soil Moisture Content and Nitrogen Levels[J]. Arid Zone Research, 2011, 28(2): 205-214. | |
| [29] |
曹树青, 赵永强, 温家立, 等. 高产小麦旗叶光合作用及与籽粒灌浆进程关系的研究[J]. 中国农业科学, 2000, 33(6):19-25.
DOI |
| CAO Shuqing, ZHAO Yongqiang, WEN Jiali, et al. Studies on Photosynthesis in Flag Leaves and Its Relation to Grain Filling Course of High-yield Wheat[J]. Scientia Agricultura Sinica, 2000, 33(6): 19-25. | |
| [30] | 杨淑巧, 许琦, 刘跃鹏, 等. 冬小麦光合作用和叶绿素荧光特性的研究[J]. 农学学报, 2015, 5(3): 6. |
| YANG Shuqiao, XU Qi, LIU Yaopeng, et al. Research on the Photosynthesis and Chlorophyll Fluorspar Characteristic of Winter Wheat[J]. Journal of Agriculture, 2015, 5(3): 6. | |
| [31] | Pallett K E, Sestak Z. Photosynthesis during Leaf Development[J]. Bioscience, 1985, 37(10): 10. |
| [32] | Hoerl A, Kennard R. Taylor & Francis Online: Ridge Regression: Biased Estimation for Nonorthogonal Problems-Technometrics-Volume 12, Issue 1[J]. Technometrics, 2000, 42(1): 7. |
| [33] |
Fenner H, Andrew R, Adam M, et al. High Throughput Field Phenotyping of Wheat Plant Height and Growth Rate in Field Plot Trials Using UAV Based Remote Sensing[J]. Remote Sensing, 2016, 8(12): 1031.
DOI URL |
| [34] | 周敏姑, 邵国敏, 张立元, 等. 无人机多光谱遥感反演冬小麦SPAD值[J]. 农业工程学报, 2020, 36(20): 125-133. |
| ZHOU Mingu, SHAO Guomin, ZHANG Liyuan, et al. Inversion of SPAD value of winter wheat by multispectral remote sensing of unmanned aerial vehicles[J]. Transactions of the Chinese Society of Agricultural Engineering, 2020, 36(20): 125-133. |
| [1] | 李进, 沈煜洋, 邓菲菲, 陈江华, 孙婧婧, 李广阔, 高海峰. 新疆小麦有害生物发生现状及防控对策分析[J]. 新疆农业科学, 2024, 61(S1): 122-126. |
| [2] | 戴爱梅, 叶梦迪, 丁志梅, 王志慧, 乔晓燕, 王小武, 付开赟, 贾尊尊, 叶晓琴, 吐尔逊·阿合买提, 康健, 丁新华, 郭文超. 不同苯唑氟草酮施药方式防除玉米田杂草药效及安全性评价[J]. 新疆农业科学, 2024, 61(S1): 28-34. |
| [3] | 方辉, 丁银灯, 范贵强, 高永红, 黄天荣. 新疆南疆小麦产业发展的现状及品质特性分析[J]. 新疆农业科学, 2024, 61(S1): 75-80. |
| [4] | 王春生, 李剑峰, 张跃强, 樊哲儒, 王重, 高新, 时佳, 张宏芝, 王立红, 夏建强, 王芳平, 赵奇. 新疆主栽春小麦品种花药培养力基因型差异分析[J]. 新疆农业科学, 2024, 61(9): 2081-2086. |
| [5] | 沈煜洋, 洪高洁, 范贵强, 陈利, 雷钧杰, 李广阔, 高海峰. 杀虫剂减施和添加助剂对红枣-小麦间作麦田蚜虫防效的影响[J]. 新疆农业科学, 2024, 61(9): 2257-2268. |
| [6] | 候丽丽, 王伟, 崔新菊, 周大伟. 有机无机肥配施对冬小麦产量和土壤养分及酶活性的影响[J]. 新疆农业科学, 2024, 61(8): 1845-1852. |
| [7] | 陈芳, 李字辉, 王兵跃, 孙孝贵, 张庭军. 微生物菌剂对冬小麦生长发育及产量的影响[J]. 新疆农业科学, 2024, 61(8): 1853-1860. |
| [8] | 袁莹莹, 赵经华, 迪力穆拉提·司马义, 杨庭瑞. 基于apriori算法对盆栽春小麦生理指标及产量的分析[J]. 新疆农业科学, 2024, 61(8): 1861-1871. |
| [9] | 袁以琳, 颜安, 左筱筱, 侯正清, 张振飞, 肖淑婷, 孙哲, 马梦倩, 赵宇航. 氮肥减量配施生物有机肥对春小麦增产及土壤培肥的影响[J]. 新疆农业科学, 2024, 61(8): 1872-1882. |
| [10] | 刘旭欢, 于姗, 刘跃, 石书兵. 不同粒级春小麦种子活力差异比较[J]. 新疆农业科学, 2024, 61(8): 1883-1887. |
| [11] | 杨梅, 赵红梅, 迪丽热巴·夏米西丁, 杨卫君, 张金汕, 惠超. 氮肥减量配施生物质炭对春小麦群体结构、光合特性及产量的影响[J]. 新疆农业科学, 2024, 61(7): 1582-1589. |
| [12] | 杜云, 张婧婧, 雷嘉诚, 李博, 李永福. 冬小麦需水量的预测模型对比分析[J]. 新疆农业科学, 2024, 61(7): 1590-1596. |
| [13] | 张振飞, 郭靖, 颜安, 侯正清, 袁以琳, 肖淑婷, 孙哲. 多光谱无人机不同飞行高度下苹果树高的提取[J]. 新疆农业科学, 2024, 61(7): 1710-1716. |
| [14] | 邵亚杰, 李珂, 丁文浩, 林涛, 崔建平, 郭仁松, 王亮, 吴凤全, 王心, 汤秋香. 基于无人机多光谱影像特征估算棉花生物量[J]. 新疆农业科学, 2024, 61(6): 1328-1335. |
| [15] | 强立栋, 冯宽, 朱长安, 赵云, 李召锋, 李卫华. 花后高温胁迫对小麦籽粒萌发及相关酶活性影响[J]. 新疆农业科学, 2024, 61(6): 1345-1351. |
| 阅读次数 | ||||||||||||||||||||||||||||||||||||||||||||||||||
|
全文 67
|
|
|||||||||||||||||||||||||||||||||||||||||||||||||
|
摘要 223
|
|
|||||||||||||||||||||||||||||||||||||||||||||||||