
Xinjiang Agricultural Sciences ›› 2023, Vol. 60 ›› Issue (1): 252-260.DOI: 10.6048/j.issn.1001-4330.2023.01.029
• Plant Protection · Soil Fertilizer · Prataculture · Animal Husbandry Veterinarian • Previous Articles
CHEN Yulan1( ), CHENG Xurui1, GUO Jun2(), SU Wuzheng2()
Received:2022-05-14
Online:2023-01-20
Published:2023-03-07
Correspondence author:
GUO Jun (1975-), male, Han nationality, Urumqi, associate researcher, research field: Agricultural information,(E-mail)58411531@qq.com;SU Wuzheng (1978-), male, Han nationality, Chongqing, researcher, research field: rural development and management,(E-mail)1326477375@qq.com
Supported by:
陈玉兰1(), 程旭睿1, 郭君2(), 苏武峥2()
通讯作者:
郭君(1975-),男,新疆乌鲁木齐人,副研究员,研究方向为农业信息与农业经济,(E-mail)58411531@qq.com;苏武峥(1978-),男,重庆人,研究员,研究方向为农村发展与管理,(E-mail)1326477375@qq.com
作者简介:陈玉兰(1980-),女,新疆乌鲁木齐人,教授,硕士生导师,研究方向为农业经济,(E-mail)75991174@qq.com
基金资助:CLC Number:
CHEN Yulan, CHENG Xurui, GUO Jun, SU Wuzheng. Regional Difference and Dynamic Evolution of Agricultural Green Development Level in China[J]. Xinjiang Agricultural Sciences, 2023, 60(1): 252-260.
陈玉兰, 程旭睿, 郭君, 苏武峥. 我国农业绿色发展水平地区差异及分布动态演进[J]. 新疆农业科学, 2023, 60(1): 252-260.
Add to citation manager EndNote|Ris|BibTeX
URL: http://www.xjnykx.com/EN/10.6048/j.issn.1001-4330.2023.01.029
| 一级指标 Level 1 indicators | 二级指标 Level 2 indicators | 三级指标 Level 3 indicators | 指标计算公式 Resource and environmental security | 指标类型 Type of indicator |
|---|---|---|---|---|
| 农业绿色发展 指数 Agricultural green development index | 经济增收 | 农业人均GDP | 第一产业总产值/乡村人口数 | 正 |
| 农村居民人均可支配收入 | 农村居民人均可支配收入 | 正 | ||
| 土地产出率 | 第一产业总产值/农作物播种面积 | 正 | ||
| 资源减量投入 | 农业节水系数 | 农作物播种面积/农业用水总量 | 正 | |
| 机械有效利用系数 | 农业机械总动力/农作物播种面积 | 正 | ||
| 农业能耗指标 | 农用柴油使用量/第一产业总产值 | 负 | ||
| 化肥施用强度 | 化肥施用折纯量/农作物播种面积 | 负 | ||
| 农药使用强度 | 农药使用量/农作物播种面积 | 负 | ||
| 农膜使用强度 | 农膜使用量/农作物播种面积 | 负 | ||
| 资源环境安全 | 有效灌溉系数 | 有效灌溉面积/农作物播种面积 | 正 | |
| 森林覆盖率 | 森林覆盖率 | 正 | ||
| 自然保护区面积比重 | 自然保护区面积比重 | 正 | ||
| 湿地面积比重 | 湿地面积比重 | 正 |
Table 1 Evaluation system of China's agricultural green development level
| 一级指标 Level 1 indicators | 二级指标 Level 2 indicators | 三级指标 Level 3 indicators | 指标计算公式 Resource and environmental security | 指标类型 Type of indicator |
|---|---|---|---|---|
| 农业绿色发展 指数 Agricultural green development index | 经济增收 | 农业人均GDP | 第一产业总产值/乡村人口数 | 正 |
| 农村居民人均可支配收入 | 农村居民人均可支配收入 | 正 | ||
| 土地产出率 | 第一产业总产值/农作物播种面积 | 正 | ||
| 资源减量投入 | 农业节水系数 | 农作物播种面积/农业用水总量 | 正 | |
| 机械有效利用系数 | 农业机械总动力/农作物播种面积 | 正 | ||
| 农业能耗指标 | 农用柴油使用量/第一产业总产值 | 负 | ||
| 化肥施用强度 | 化肥施用折纯量/农作物播种面积 | 负 | ||
| 农药使用强度 | 农药使用量/农作物播种面积 | 负 | ||
| 农膜使用强度 | 农膜使用量/农作物播种面积 | 负 | ||
| 资源环境安全 | 有效灌溉系数 | 有效灌溉面积/农作物播种面积 | 正 | |
| 森林覆盖率 | 森林覆盖率 | 正 | ||
| 自然保护区面积比重 | 自然保护区面积比重 | 正 | ||
| 湿地面积比重 | 湿地面积比重 | 正 |
| 年份 Years | 全国 National | 地区内基尼系数 Gini coefficient in the region | 地区间基尼系数 Int er-regional Gini coefficient | 贡献率 Contribution | ||||||
|---|---|---|---|---|---|---|---|---|---|---|
| 超变密度 Hyperva riable density | 东 East | 中 Middle | 西 West | 东-中 East- Middle | 东-西 East- West | 中-西 Middle- West | 地区内 Region | 地区间 Inter- regional | ||
| 2010 | 0.094 | 0.055 | 0.053 | 0.1 13 | 0.069 | 0.102 | 0.093 | 28.766 | 40.96 | 30.274 |
| 2011 | 0.095 | 0.053 | 0.057 | 0.111 | 0.071 | 0.103 | 0.092 | 27.823 | 44.623 | 27.554 |
| 2012 | 0.097 | 0.054 | 0.06. | 0.107 | 0.074 | 0.105 | 0.091 | 27.041 | 47.307 | 25.652 |
| 2013 | 0.102 | 0.065 | 0.054 | 0.102 | 0.086 | 0.109 | 0.086 | 26.319 | 50.54 | 23.141 |
| 2014 | 0.103 | 0.068 | 0.049 | 0.103 | 0.086 | 0.112 | 0.085 | 26.097 | 51.693 | 22.21 |
| 2015 | 0.104 | 0.066 | 0.053 | 0.101 | 0.088 | 0.112 | 0.085 | 25.519 | 52.42 | 22.061 |
| 2016 | 0.109 | 0.077 | 0.065 | 0.099 | 0.097 | 0.116 | 0.089 | 26.242 | 52.797 | 20.961 |
| 2017 | 0.1 l | 0.078 | 0.067 | 0.094 | 0.101 | 0.115 | 0.087 | 25.76 | 54.38 | 19.86 |
| 2018 | 0.108 | 0.079 | 0.063 | 0.091 | 0.101 | 0.113 | 0.082 | 25.714 | 55.621 | 18.665 |
| 平均增长率 Average growth rate | 0.018 | 0.046 | 0.022 | -0.027 | 0.049 | 0.013 | -0.016 | -0.014 | 0.039 | -0.059 |
Table 2 Gini coefficient and its decomposition results of green agricultural development level in China
| 年份 Years | 全国 National | 地区内基尼系数 Gini coefficient in the region | 地区间基尼系数 Int er-regional Gini coefficient | 贡献率 Contribution | ||||||
|---|---|---|---|---|---|---|---|---|---|---|
| 超变密度 Hyperva riable density | 东 East | 中 Middle | 西 West | 东-中 East- Middle | 东-西 East- West | 中-西 Middle- West | 地区内 Region | 地区间 Inter- regional | ||
| 2010 | 0.094 | 0.055 | 0.053 | 0.1 13 | 0.069 | 0.102 | 0.093 | 28.766 | 40.96 | 30.274 |
| 2011 | 0.095 | 0.053 | 0.057 | 0.111 | 0.071 | 0.103 | 0.092 | 27.823 | 44.623 | 27.554 |
| 2012 | 0.097 | 0.054 | 0.06. | 0.107 | 0.074 | 0.105 | 0.091 | 27.041 | 47.307 | 25.652 |
| 2013 | 0.102 | 0.065 | 0.054 | 0.102 | 0.086 | 0.109 | 0.086 | 26.319 | 50.54 | 23.141 |
| 2014 | 0.103 | 0.068 | 0.049 | 0.103 | 0.086 | 0.112 | 0.085 | 26.097 | 51.693 | 22.21 |
| 2015 | 0.104 | 0.066 | 0.053 | 0.101 | 0.088 | 0.112 | 0.085 | 25.519 | 52.42 | 22.061 |
| 2016 | 0.109 | 0.077 | 0.065 | 0.099 | 0.097 | 0.116 | 0.089 | 26.242 | 52.797 | 20.961 |
| 2017 | 0.1 l | 0.078 | 0.067 | 0.094 | 0.101 | 0.115 | 0.087 | 25.76 | 54.38 | 19.86 |
| 2018 | 0.108 | 0.079 | 0.063 | 0.091 | 0.101 | 0.113 | 0.082 | 25.714 | 55.621 | 18.665 |
| 平均增长率 Average growth rate | 0.018 | 0.046 | 0.022 | -0.027 | 0.049 | 0.013 | -0.016 | -0.014 | 0.039 | -0.059 |

Fig.1 Evolution of the overall spatial differenceof agricultural green development level in China

Fig.2 Regional differences in green agricultural development level in China

Fig.3 Regional difference of green development level of agriculture in China
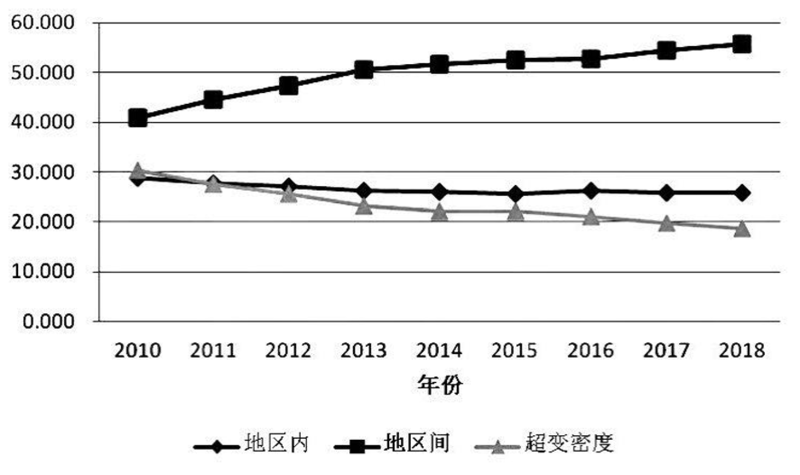
Fig.4 Contribution of China's agricultural green development level
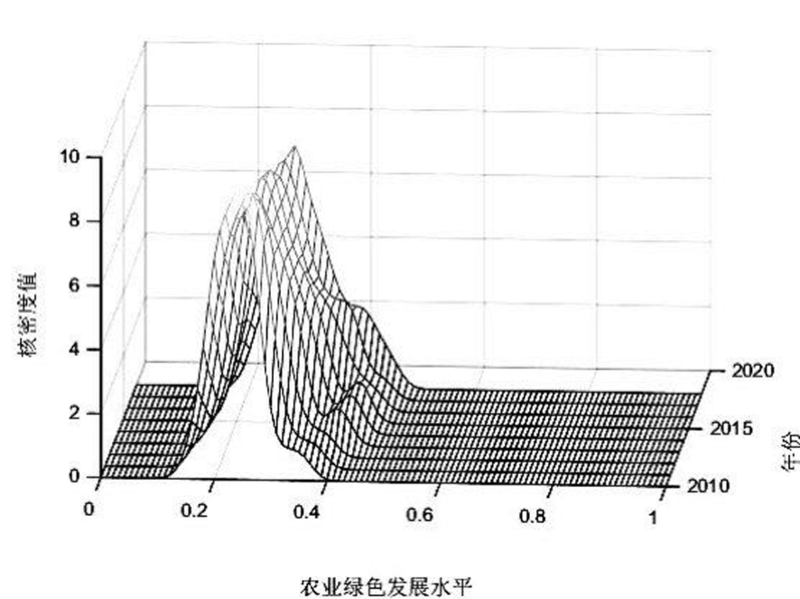
Fig.5 Nuclear agricultural green development level nuclear density map

Fig.6 Nuclear density of green development level in eastern agriculture
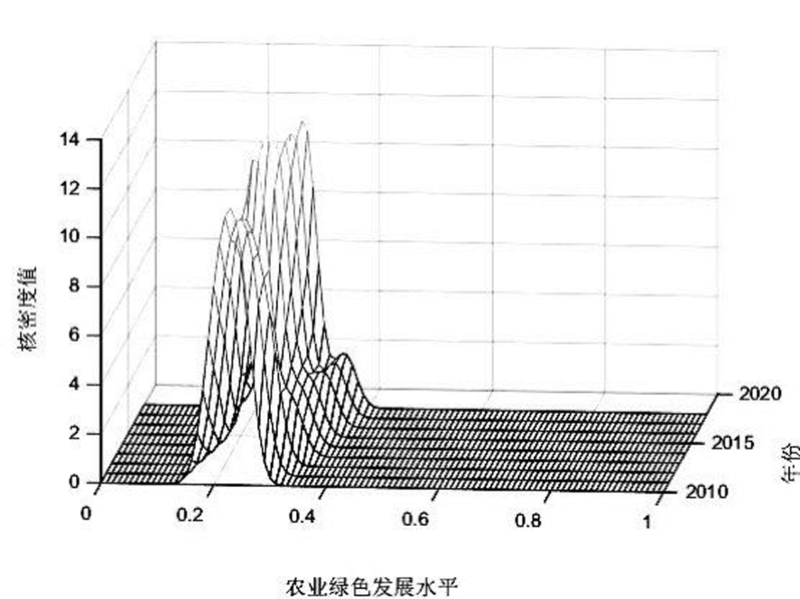
Fig.7 Central agricultural green development level nuclear density map
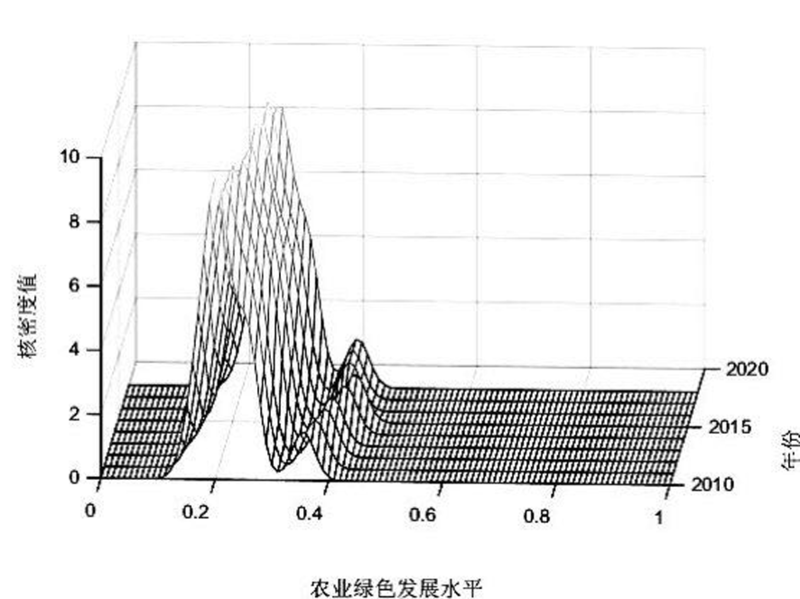
Fig.8 Nuclear density of green development level in western agriculture
| t/t+1 | Ⅰ | Ⅱ | Ⅲ | Ⅳ |
|---|---|---|---|---|
| Ⅰ | 0.642 9 | 0.357 1 | 0 | 0 |
| Ⅱ | 0.012 5 | 0.712 5 | 0.275 | 0 |
| Ⅲ | 0 | 0.041 7 | 0.843 8 | 0.114 6 |
| Ⅳ | 0 | 0 | 0.022 7 | 0.977 3 |
Table 3 The transfer matrix probability of China's agricultural green development level: 2010-2018
| t/t+1 | Ⅰ | Ⅱ | Ⅲ | Ⅳ |
|---|---|---|---|---|
| Ⅰ | 0.642 9 | 0.357 1 | 0 | 0 |
| Ⅱ | 0.012 5 | 0.712 5 | 0.275 | 0 |
| Ⅲ | 0 | 0.041 7 | 0.843 8 | 0.114 6 |
| Ⅳ | 0 | 0 | 0.022 7 | 0.977 3 |
| 分布 Distributing | Ⅰ | Ⅱ | Ⅲ | Ⅳ |
|---|---|---|---|---|
| 初始分布 Original distribution | 0.290 3 | 0.419 4 | 0.225 8 | 0.064 5 |
| 稳态分布 Steady-state distribution | 0.000 9 | 0.024 4 | 0.1613 | 0.813 4 |
Table 4 Initial and steady distribution of green development level of agriculture in China
| 分布 Distributing | Ⅰ | Ⅱ | Ⅲ | Ⅳ |
|---|---|---|---|---|
| 初始分布 Original distribution | 0.290 3 | 0.419 4 | 0.225 8 | 0.064 5 |
| 稳态分布 Steady-state distribution | 0.000 9 | 0.024 4 | 0.1613 | 0.813 4 |
| [1] | 郑丽楠, 洪名勇. 中国农业生态效率的时空特征及驱动因素[J]. 江西财经大学学报, 2019,(5):46-56. |
| ZHEN Linan, HONG Mingyong. Temporal and spatial characteristics and driving factors of agro-ecological efficiency in China[J]. Journal of Jiangxi University of Finance and Economics, 2019,(5):46-56. | |
| [2] | 展进涛, 徐钰娇. 环境规制、农业绿色生产率与粮食安全[J]. 中国人口·资源与环境, 2019, 29(3):167-176. |
| ZHEN Jintao, XU Yujiao. Environmental regulation, agricultural green TFP and grain security[J]. China Population, Resources and Environment, 2019, 29(3):167-176. | |
| [3] | 金赛美. 中国省际农业绿色发展水平及区域差异评价[J]. 求索, 2019(2):89-95. |
| JIN Saimei. Evaluation of Green Development Level and Regional Difference of Agriculture in China[J]. Seeker, 2019(2):89-95. | |
| [4] |
陈玉兰, 苏武峥, 罗万云. 农户生计资本对生态退化逆转趋势影响分析[J]. 新疆农业科学, 2020, 57(10):1948-1957.
DOI |
|
CHEN Yulan, SU Wuzheng, LUO Wanyun. Analysis of the Impact of Farmers' Livelihood Capital on the Reversal Trend of Ecological Degradation[J]. Xinjiang Agricultural Sciences, 2020, 57(10):1948-1957.
DOI |
|
| [5] | 何寿奎. 农村生态环境补偿与绿色发展协同推进动力机制及政策研究[J]. 现代经济探讨, 2019,(6):106-113. |
| HE Shoukui. Study on the Dynamic Mechanism and Policy of Coordinated Promotion of Rural Ecological Environment Compensation and Green Development[J]. Modern Economic Research, 2019,(6):106-113. | |
| [6] | 石志恒, 慕宏杰, 孙艳. 农业补贴对农户参与农业绿色发展的影响研究[J]. 产经评论, 2019, 10(3):144-154. |
| SHI Zhiheng, MU Hongjie, SUN Yan. A Study on the Influence of Agricultural Subsidy on Farmer Participation in Green Development of Agriculture[J]. Industrial Economic Review, 2019, 10(3):144-154. | |
| [7] | 于法稳. 习近平绿色发展新思想与农业的绿色转型发展[J]. 中国农村观察, 2016,(5):2-9,94. |
| YU Fawen. New Ideas of Green Development of Xi Jinping and Green Transformation of Agriculture[J]. China Rural Survey, 2016,(5):2-9,94. | |
| [8] | 中华人民共和国国家统计局, 中国统计年鉴[J]. 北京, 中国统计出版社, 2012- 2020. |
| State Statistical Bureau of the People's Republic of China. China statistical yearbook of [J]. Beijing, China Statistics Press, 2012- 2020. | |
| [9] | 国家统计局农村社会经济调查司, 中国农村统计年鉴[J]. 北京, 中国统计出版社, 2012- 2020. |
| Rural Social and Economic Investigation Division of National Bureau of Statistics of the People's Republic of China. China rural statistical yearbook[J]. Beijing, China Statistics Press, 2012- 2020. | |
| [10] | 中华人民共和国国家统计局, 中国环境统计年鉴[J]. 北京, 中国统计出版社, 2012- 2020. |
| State Statistical Bureau of the People's Republic of China. China statistical yearbook on Environment[J]. Beijing, China Statistics Press, 2012- 2020. | |
| [11] | 赵巧芝, 闫庆友. 中国技术创新分布的空间非均衡特征及动态趋势测度[J]. 中国科技论坛, 2020,(7):160-169. |
| ZHAO Youzhi, YAN Qingyou. Spatial Unbalance Character and Dynamic Trends Analysis of Regional Technological Innovation in China[J]. Forum on Science and Technology in China, 2020,(7):160-169. | |
| [12] | 陈明华, 仲崇阳, 张晓萌, 等. 长江经济带城市污染排放分布动态及趋势[J]. 城市问题, 2018,(11):37-48. |
| CHEN Minghua, ZHONG Chongyang, ZHANG Xiaomeng, et al. Distributional dynamic and trend prediction of urban pollution emission in Yangtze River Economic Belt[J]. Urban Problems, 2018,(11):37-48. | |
| [13] |
张国俊, 王珏晗, 吴坤津, 等. 中国三大城市群经济与环境协调度时空特征及影响因素[J]. 地理研究, 2020, 39(2):272-288.
DOI |
|
ZHANG Guojun, WANG Yuhan, WU kunjin, et al. Spatial-temporal characteristics and influencing factors of coordination between economic and environmental development of three major urban agglomerations in China[J]. Geographical Research, 2020, 39(2):272-288.
DOI |
|
| [14] | 郭海红, 张在旭, 方丽芬. 中国农业绿色全要素生产率时空分异与演化研究[J]. 现代经济探讨, 2018,(6):85-94. |
| GUO Haihong, ZHANG Zaixu, FANG Lifen. The Spatial-Temporal Differentiation and Evolution of Agricultural Green Total Factor Productivity in China[J]. Modern Economic Research, 2018,(6):85-94. | |
| [15] | 赵会杰, 于法稳. 基于熵值法的粮食主产区农业绿色发展水平评价[J]. 改革, 2019,(11):136-146. |
| ZHAO Huijie, YU Fawen. Evaluation of Agricultural Green Development Level in Main Grain Producing Areas based on Entropy Method[J]. Reform, 2019,(11):136-146. | |
| [16] | 巩前文, 李学敏. 农业绿色发展指数构建与测度:2005—2018年[J]. 改革, 2020,(1):133-145. |
| GONG Qianwen, LI Xuemin. Construction and Measurement of Agricultural Green Development Index: 2005-2018 [J]. Reform, 2020,(1):133-145. | |
| [17] | 辛岭, 安晓宁. 我国农业高质量发展评价体系构建与测度分析[J]. 经济纵横, 2019,(5):109-118. |
| XIN Lin, AN Xiaoning. Construction and Empirical Analysis of Agricultural High-quality Development Evaluation System in China[J]. Economic Review Journal, 2019,(5):109-118. | |
| [18] | 丘雯文, 钟涨宝, 原春辉, 等. 中国农业面源污染排放的空间差异及其动态演变[J]. 中国农业大学学报, 2018, 23(1):152-163. |
| QIU Wenwen, ZHONG Zhangbao, YUAN Chunhui, et al. Spatial differences and dynamic evolution of agricultural non-point source pollution in China[J]. Journal of China Agricultural University, 2018, 23(1):152-163. | |
| [19] | 李欠男, 李谷成, 尹朝静. 农业绿色全要素生产率增长的分布动态演进[J]. 统计与信息论坛, 2020, 35(10):119-128. |
| LI Qiannan, LI Guchen, YIN Chaojing. Dynamic Evolution of Agricultural Green Total Factor Productivity Growth[J]. Journal of Statistics and Information, 2020, 35(10):119-128. |
| [1] | RAN Qi-ying;ZHOU Hui. Regional Differences and Convergence Analysis of Agricultural Total Factor Energy Efficiency in China: 1997-2012 [J]. , 2015, 52(6): 1169-1176. |
| [2] | CONG Hua;Tatsuya M. Ikeda;Kanenori Takata;Mikiko Yanaka;Hiroshi Fujimaki;Tsukasa Nagamine. Geographical Distribution of High - Molecular - Weight Glutenin Subunits and Characterization of a New High - Molecular - Weight Glutenin Subu nit of Winter Wheat Landraces (Triticum aestivum L.)in the Xinjiang Uygur Autonomous District of China [J]. , 2011, 48(9): 1576-1584. |
| Viewed | ||||||
|
Full text |
|
|||||
|
Abstract |
|
|||||