
Xinjiang Agricultural Sciences ›› 2025, Vol. 62 ›› Issue (S1): 218-224.DOI: 10.6048/j.issn.1001-4330.2025.S1.043
• Management of scientific research· Agricultural economy colume • Previous Articles Next Articles
ZHAO Xiaomeng( ), GAO Min, SUN Zhaozhan, HU Lingling, LIU Yuan, GUO Chunmiao, YAO Yanling()
Received:2025-06-20
Online:2025-10-10
Published:2025-10-29
Correspondence author:
YAO Yanling
Supported by:
赵小萌(), 高敏, 孙召展, 胡伶岭, 刘媛, 郭春苗, 姚艳玲()
通讯作者:
姚艳玲
作者简介:赵小萌(1995-),女,河北满城人,硕士研究生,研究方向为农业经济管理,(E-mail)m740312397@163.com
基金资助:CLC Number:
ZHAO Xiaomeng, GAO Min, SUN Zhaozhan, HU Lingling, LIU Yuan, GUO Chunmiao, YAO Yanling. Characterizing the dynamic evolution of green total factor productivity in Xinjiang agriculture[J]. Xinjiang Agricultural Sciences, 2025, 62(S1): 218-224.
赵小萌, 高敏, 孙召展, 胡伶岭, 刘媛, 郭春苗, 姚艳玲. 新疆农业绿色全要素生产率动态演变特征分析[J]. 新疆农业科学, 2025, 62(S1): 218-224.
Add to citation manager EndNote|Ris|BibTeX
URL: https://www.xjnykx.com/EN/10.6048/j.issn.1001-4330.2025.S1.043
| 指标类型 Indicator Type | 一级指标 First level indicator | 二级指标 Second level indicator |
|---|---|---|
| 投入指标 Input indicators | 化肥投入 | 化肥施用量(t) |
| 人员投入 | 从事农业人员(人) | |
| 土地投入 | 农作物播种面积(103hm2)千公顷 | |
| 机械投入 | 农业机械总动力(kW)千瓦 | |
| 灌溉投入 | 农业用水量(108m3)亿立方米 | |
| 农膜投入 | 农膜使用量(kg) | |
| 用电投入 | 农业用电量(104kW·h) | |
| 期望产出 Expected output | 农业总产值 | 农林牧渔业 总产值(104元) |
| 非期望产出 Non-expected output | 碳排放 | 各碳排放源 排放量总和(kg) |
Tab.1 Indicator system for measuring agricultural green total factor productivity
| 指标类型 Indicator Type | 一级指标 First level indicator | 二级指标 Second level indicator |
|---|---|---|
| 投入指标 Input indicators | 化肥投入 | 化肥施用量(t) |
| 人员投入 | 从事农业人员(人) | |
| 土地投入 | 农作物播种面积(103hm2)千公顷 | |
| 机械投入 | 农业机械总动力(kW)千瓦 | |
| 灌溉投入 | 农业用水量(108m3)亿立方米 | |
| 农膜投入 | 农膜使用量(kg) | |
| 用电投入 | 农业用电量(104kW·h) | |
| 期望产出 Expected output | 农业总产值 | 农林牧渔业 总产值(104元) |
| 非期望产出 Non-expected output | 碳排放 | 各碳排放源 排放量总和(kg) |
| 碳排放源 Carbon emission sources | 碳排放系数 Carbon emission factor | 参考值来源 Reference value source |
|---|---|---|
| 化肥 Chemical fertilizer | 0.895 6 kg/kg | 美国橡树岭国家实验室[ |
| 农膜 Agricultural plastic film | 5.18 kg/kg | IPCC[ |
| 柴油 Diesel fuel | 0.5927kg/kg | 南京农业大学农业资源与 生态环境研究所[ |
| 灌溉Irrigation | 266.48kg/hm2 | 段华平等[ |
| 翻耕Plowing | 312.6kg/hm2 | 伍芬琳等[ |
Tab.2 Agricultural carbon emission source coefficien
| 碳排放源 Carbon emission sources | 碳排放系数 Carbon emission factor | 参考值来源 Reference value source |
|---|---|---|
| 化肥 Chemical fertilizer | 0.895 6 kg/kg | 美国橡树岭国家实验室[ |
| 农膜 Agricultural plastic film | 5.18 kg/kg | IPCC[ |
| 柴油 Diesel fuel | 0.5927kg/kg | 南京农业大学农业资源与 生态环境研究所[ |
| 灌溉Irrigation | 266.48kg/hm2 | 段华平等[ |
| 翻耕Plowing | 312.6kg/hm2 | 伍芬琳等[ |
| 年份 Year | GTFP | GEC | GTC |
|---|---|---|---|
| 2012-2013 | 1.000 039 | 1.000 089 | 0.999 949 |
| 2013-2014 | 0.996 941 | 0.997 303 | 0.999 653 |
| 2014-2015 | 0.999 013 | 1.000 671 | 0.998 361 |
| 2015-2016 | 0.998 341 | 0.996 867 | 1.001 499 |
| 2016-2017 | 0.995 182 | 0.998 037 | 0.997 145 |
| 2017-2018 | 1.000 501 | 1.008 055 | 0.992 527 |
| 2018-2019 | 1.009 445 | 0.973 723 | 1.037 26 |
| 2019-2020 | 0.997 814 | 1.019 516 | 0.979 154 |
| 2020-2021 | 1.003 097 | 0.994 175 | 1.009 006 |
| 均值 | 1.000 042 | 0.998 715 | 1.001 617 |
Tab.3 Xinjiang agricultural GTFP index and GEC GTC index mean from 2012 to 2021
| 年份 Year | GTFP | GEC | GTC |
|---|---|---|---|
| 2012-2013 | 1.000 039 | 1.000 089 | 0.999 949 |
| 2013-2014 | 0.996 941 | 0.997 303 | 0.999 653 |
| 2014-2015 | 0.999 013 | 1.000 671 | 0.998 361 |
| 2015-2016 | 0.998 341 | 0.996 867 | 1.001 499 |
| 2016-2017 | 0.995 182 | 0.998 037 | 0.997 145 |
| 2017-2018 | 1.000 501 | 1.008 055 | 0.992 527 |
| 2018-2019 | 1.009 445 | 0.973 723 | 1.037 26 |
| 2019-2020 | 0.997 814 | 1.019 516 | 0.979 154 |
| 2020-2021 | 1.003 097 | 0.994 175 | 1.009 006 |
| 均值 | 1.000 042 | 0.998 715 | 1.001 617 |
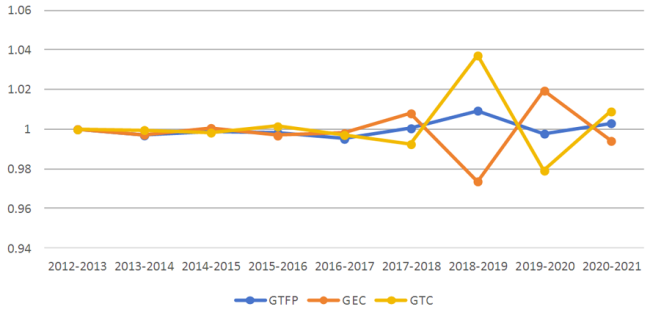
Fig.1 Changes in Xinjiang agricultural GTFP index and GEC GTC index mean from 2012 to 2021
| 地区名称Regional name | GTFP | GEC | GTC | GTFP排序 |
|---|---|---|---|---|
| 乌鲁木齐市Urumqi City | 1.000 129 | 1 | 1.000 129 | 7 |
| 克拉玛依市Karamay | 1.000 152 | 1 | 1.000 152 | 6 |
| 吐鲁番市Turpan City | 1.000 398 | 1 | 1.000 398 | 4 |
| 哈密市Hami City | 0.999 790 | 0.999 411 | 1.000 421 | 9 |
| 昌吉回族自治州(简称昌吉州) Changji Hui Autonomous Prefecture | 0.998 841 | 0.998 661 | 1.000 742 | 11 |
| 伊犁哈萨克自治州(简称伊犁州) Ili Kazak Autonomous Prefecture | 1.005 822 | 1.000 938 | 1.004 878 | 1 |
| 塔城地区Tarbagatay Prefecture | 0.999 474 | 0.997 598 9 | 1.001 913 | 10 |
| 阿勒泰地区Altay Prefecture | 0.996 568 | 0.997 081 | 1.000 6 | 15 |
| 博尔塔拉蒙古自治州(简称博州) Bortala Mongol Autonomous Prefecture | 0.998 111 | 0.997 527 | 1.000 994 | 14 |
| 巴音郭楞蒙古自治州(简称巴州) Bayingolin Mongolian Autonomous Prefecture | 0.998 296 | 0.997 659 | 1.001 219 | 12 |
| 阿克苏地区Aksu Prefecture | 1.000 714 | 0.999 816 | 1.001 41 | 3 |
| 克孜勒苏柯尔克孜自治州(简称克州) Kizilsu Kirgiz Autonomous Prefecture | 0.998 140 | 0.993 930 | 1.004 615 | 13 |
| 喀什地区Kashgar Prefecture | 0.999 849 | 0.999 043 | 1.001 55 | 8 |
| 和田地区Hotan Prefecture | 1.004 169 | 0.999 061 | 1.005 062 | 2 |
| 新疆生产建设兵团(简称兵团) Xinjiang Production and Construction Corps | 1.000 173 | 1 | 1.000 173 | 5 |
| 均值Mean value | 1.000 042 | 0.998 715 | 1.001 617 |
Tab.4 Mean and ranking of agricultural GTFP index and GEC GTC index in various prefectures of Xinjiang from 2012 to 2021
| 地区名称Regional name | GTFP | GEC | GTC | GTFP排序 |
|---|---|---|---|---|
| 乌鲁木齐市Urumqi City | 1.000 129 | 1 | 1.000 129 | 7 |
| 克拉玛依市Karamay | 1.000 152 | 1 | 1.000 152 | 6 |
| 吐鲁番市Turpan City | 1.000 398 | 1 | 1.000 398 | 4 |
| 哈密市Hami City | 0.999 790 | 0.999 411 | 1.000 421 | 9 |
| 昌吉回族自治州(简称昌吉州) Changji Hui Autonomous Prefecture | 0.998 841 | 0.998 661 | 1.000 742 | 11 |
| 伊犁哈萨克自治州(简称伊犁州) Ili Kazak Autonomous Prefecture | 1.005 822 | 1.000 938 | 1.004 878 | 1 |
| 塔城地区Tarbagatay Prefecture | 0.999 474 | 0.997 598 9 | 1.001 913 | 10 |
| 阿勒泰地区Altay Prefecture | 0.996 568 | 0.997 081 | 1.000 6 | 15 |
| 博尔塔拉蒙古自治州(简称博州) Bortala Mongol Autonomous Prefecture | 0.998 111 | 0.997 527 | 1.000 994 | 14 |
| 巴音郭楞蒙古自治州(简称巴州) Bayingolin Mongolian Autonomous Prefecture | 0.998 296 | 0.997 659 | 1.001 219 | 12 |
| 阿克苏地区Aksu Prefecture | 1.000 714 | 0.999 816 | 1.001 41 | 3 |
| 克孜勒苏柯尔克孜自治州(简称克州) Kizilsu Kirgiz Autonomous Prefecture | 0.998 140 | 0.993 930 | 1.004 615 | 13 |
| 喀什地区Kashgar Prefecture | 0.999 849 | 0.999 043 | 1.001 55 | 8 |
| 和田地区Hotan Prefecture | 1.004 169 | 0.999 061 | 1.005 062 | 2 |
| 新疆生产建设兵团(简称兵团) Xinjiang Production and Construction Corps | 1.000 173 | 1 | 1.000 173 | 5 |
| 均值Mean value | 1.000 042 | 0.998 715 | 1.001 617 |
| 地区名称 Regional name | 年份Year | ||||||||
|---|---|---|---|---|---|---|---|---|---|
| 2012-2013 | 2013-2014 | 2014-2015 | 2015-2016 | 2016-2017 | 2017-2018 | 2018-2019 | 2019-2020 | 2020-2021 | |
| 乌鲁木齐市Urumqi City | 0.996 5 | 0.978 4 | 1.025 6 | 0.985 9 | 0.985 3 | 1.001 4 | 1.028 | 1 | 1 |
| 克拉玛依市Karamay | 1 | 1 | 1 | 0.993 1 | 1.006 9 | 0.967 9 | 0.982 4 | 1.025 7 | 1.025 3 |
| 吐鲁番市Turpan City | 1.003 5 | 1 | 0.99 6 | 1.004 | 0.994 7 | 0.999 | 1.006 4 | 1 | 1 |
| 哈密市Hami City | 1.000 2 | 0.989 5 | 1.002 4 | 1.000 5 | 0.991 4 | 1.000 7 | 1.005 6 | 1.011 1 | 0.996 9 |
| 昌吉回族自治州 Changji Hui Autonomous Prefecture | 1.007 3 | 1.004 1 | 0.987 8 | 0.995 1 | 0.995 8 | 1 | 0.997 4 | 1.005 9 | 0.996 2 |
| 伊犁哈萨克自治州 Ili Kazak Autonomous Prefecture | 1.000 6 | 0.998 5 | 0.997 7 | 0.999 4 | 0.996 9 | 0.998 4 | 1.060 9 | 0.992 7 | 1.007 3 |
| 塔城地区Tarbagatay Prefecture | 0.999 5 | 0.998 4 | 0.996 9 | 1.000 4 | 0.996 | 0.998 7 | 1.071 2 | 0.932 2 | 1.001 9 |
| 阿勒泰地区Altay Prefecture | 0.982 9 | 0.996 8 | 0.999 4 | 1.000 9 | 0.993 1 | 0.997 4 | 0.989 2 | 1.008 5 | 1.000 9 |
| 博尔塔拉蒙古自治州 Bortala Mongol Autonomous Prefecture | 0.9961 | 0.9942 | 0.9993 | 0.9972 | 0.9903 | 0.9995 | 1.0002 | 1.0021 | 1.0041 |
| 巴音郭楞蒙古自治州 Bayingolin Mongolian Autonomous Prefecture | 0.999 6 | 0.998 | 0.993 3 | 0.999 3 | 0.994 9 | 1.000 6 | 0.995 8 | 1.002 | 1.001 2 |
| 阿克苏地区Aksu Prefecture | 1.002 2 | 0.998 1 | 1.000 3 | 0.994 6 | 0.994 8 | 0.999 | 1.005 4 | 1.006 3 | 1.005 7 |
| 克孜勒苏柯尔克孜自治州 Kizilsu Kirgiz Autonomous Prefecture | 1.003 5 | 0.997 3 | 0.996 6 | 0.996 6 | 0.996 6 | 0.997 2 | 0.993 4 | 1.001 7 | 1.000 3 |
| 喀什地区Kashgar Prefecture | 1.000 1 | 1.011 6 | 0.989 3 | 0.998 6 | 0.995 4 | 0.994 2 | 0.999 3 | 1.006 9 | 1.003 2 |
| 和田地区Hotan Prefecture | 1.001 4 | 0.997 4 | 0.998 3 | 1.007 3 | 0.995 2 | 1.050 6 | 1.007 3 | 0.975 | 1.005 |
| 新疆生产建设兵团 Xinjiang Production and Construction Corps | 1.007 1 | 0.992 1 | 1.002 2 | 1.002 2 | 1.000 5 | 1.003 1 | 0.999 1 | 0.996 9 | 0.998 4 |
Tab.5 Agricultural GTFP index of various prefectures in Xinjiang from 2012 to 2021
| 地区名称 Regional name | 年份Year | ||||||||
|---|---|---|---|---|---|---|---|---|---|
| 2012-2013 | 2013-2014 | 2014-2015 | 2015-2016 | 2016-2017 | 2017-2018 | 2018-2019 | 2019-2020 | 2020-2021 | |
| 乌鲁木齐市Urumqi City | 0.996 5 | 0.978 4 | 1.025 6 | 0.985 9 | 0.985 3 | 1.001 4 | 1.028 | 1 | 1 |
| 克拉玛依市Karamay | 1 | 1 | 1 | 0.993 1 | 1.006 9 | 0.967 9 | 0.982 4 | 1.025 7 | 1.025 3 |
| 吐鲁番市Turpan City | 1.003 5 | 1 | 0.99 6 | 1.004 | 0.994 7 | 0.999 | 1.006 4 | 1 | 1 |
| 哈密市Hami City | 1.000 2 | 0.989 5 | 1.002 4 | 1.000 5 | 0.991 4 | 1.000 7 | 1.005 6 | 1.011 1 | 0.996 9 |
| 昌吉回族自治州 Changji Hui Autonomous Prefecture | 1.007 3 | 1.004 1 | 0.987 8 | 0.995 1 | 0.995 8 | 1 | 0.997 4 | 1.005 9 | 0.996 2 |
| 伊犁哈萨克自治州 Ili Kazak Autonomous Prefecture | 1.000 6 | 0.998 5 | 0.997 7 | 0.999 4 | 0.996 9 | 0.998 4 | 1.060 9 | 0.992 7 | 1.007 3 |
| 塔城地区Tarbagatay Prefecture | 0.999 5 | 0.998 4 | 0.996 9 | 1.000 4 | 0.996 | 0.998 7 | 1.071 2 | 0.932 2 | 1.001 9 |
| 阿勒泰地区Altay Prefecture | 0.982 9 | 0.996 8 | 0.999 4 | 1.000 9 | 0.993 1 | 0.997 4 | 0.989 2 | 1.008 5 | 1.000 9 |
| 博尔塔拉蒙古自治州 Bortala Mongol Autonomous Prefecture | 0.9961 | 0.9942 | 0.9993 | 0.9972 | 0.9903 | 0.9995 | 1.0002 | 1.0021 | 1.0041 |
| 巴音郭楞蒙古自治州 Bayingolin Mongolian Autonomous Prefecture | 0.999 6 | 0.998 | 0.993 3 | 0.999 3 | 0.994 9 | 1.000 6 | 0.995 8 | 1.002 | 1.001 2 |
| 阿克苏地区Aksu Prefecture | 1.002 2 | 0.998 1 | 1.000 3 | 0.994 6 | 0.994 8 | 0.999 | 1.005 4 | 1.006 3 | 1.005 7 |
| 克孜勒苏柯尔克孜自治州 Kizilsu Kirgiz Autonomous Prefecture | 1.003 5 | 0.997 3 | 0.996 6 | 0.996 6 | 0.996 6 | 0.997 2 | 0.993 4 | 1.001 7 | 1.000 3 |
| 喀什地区Kashgar Prefecture | 1.000 1 | 1.011 6 | 0.989 3 | 0.998 6 | 0.995 4 | 0.994 2 | 0.999 3 | 1.006 9 | 1.003 2 |
| 和田地区Hotan Prefecture | 1.001 4 | 0.997 4 | 0.998 3 | 1.007 3 | 0.995 2 | 1.050 6 | 1.007 3 | 0.975 | 1.005 |
| 新疆生产建设兵团 Xinjiang Production and Construction Corps | 1.007 1 | 0.992 1 | 1.002 2 | 1.002 2 | 1.000 5 | 1.003 1 | 0.999 1 | 0.996 9 | 0.998 4 |
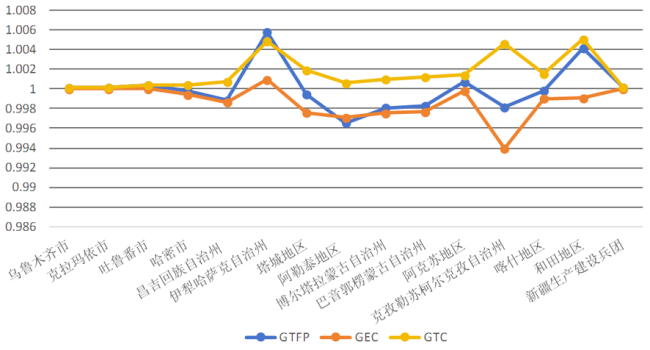
Fig.2 Changes in agricultural GTFP index and GEC GTC index in various prefectures of Xinjiang from 2012 to 2021
| 地域名称 Regional name | GTFP | GEC | GTC |
|---|---|---|---|
| 北疆 Northern Xinjiang | 1.001 136 | 0.999 024 | 1.001 136 |
| 南疆 Southern Xinjiang | 1.002 772 | 0.997 902 | 1.002 772 |
| 新疆生产建设兵团 Xinjiang Production and Construction Corps | 1.000 173 | 1 | 1.000 173 |
Tab.6 Mean agricultural GTFP index and GEC GTC index in different regions of Xinjiang from 2012 to 2021
| 地域名称 Regional name | GTFP | GEC | GTC |
|---|---|---|---|
| 北疆 Northern Xinjiang | 1.001 136 | 0.999 024 | 1.001 136 |
| 南疆 Southern Xinjiang | 1.002 772 | 0.997 902 | 1.002 772 |
| 新疆生产建设兵团 Xinjiang Production and Construction Corps | 1.000 173 | 1 | 1.000 173 |
| 年份 Year | 矩阵1Matrix 1 | 矩阵2Matrix 2 | 矩阵3Matrix 3 | 矩阵4Matrix 4 | ||||
|---|---|---|---|---|---|---|---|---|
| Moran | P值 | Moran | P值 | Moran | P值 | Moran | P值 | |
| 2012-2013 | -0.063 | 0.379 | 0.022 | 0.294 | -0.055 | 0.463 | -0.052 | 0.276 |
| 2013-2014 | -0.088 | 0.294 | -0.099 | 0.442 | -0.335 | 0.082 | -0.084 | 0.359 |
| 2014-2015 | -0.091 | 0.225 | -0.192 | 0.224 | -0.559 | 0.001 | -0.054 | 0.283 |
| 2015-2016 | -0.102 | 0.179 | -0.235 | 0.205 | -0.014 | 0.387 | -0.049 | 0.268 |
| 2016-2017 | -0.061 | 0.367 | -0.035 | 0.291 | 0.002 | 0.352 | -0.047 | 0.241 |
| 2017-2018 | -0.075 | 0.437 | -0.045 | 0.430 | -0.041 | 0.421 | -0.097 | 0.192 |
| 2018-2019 | -0.092 | 0.263 | -0.407 | 0.043 | -0.407 | 0.043 | -0.040 | 0.191 |
| 2019-2020 | -0.076 | 0.431 | -0.625 | 0.000 | -0.576 | 0.001 | -0.025 | 0.066 |
| 2020-2021 | -0.083 | 0.314 | 0.006 | 0.306 | 0.047 | 0.214 | -0.065 | 0.417 |
Tab.7 Global moran index of Xinjiang agricultural GTFP from 2012 to 2021
| 年份 Year | 矩阵1Matrix 1 | 矩阵2Matrix 2 | 矩阵3Matrix 3 | 矩阵4Matrix 4 | ||||
|---|---|---|---|---|---|---|---|---|
| Moran | P值 | Moran | P值 | Moran | P值 | Moran | P值 | |
| 2012-2013 | -0.063 | 0.379 | 0.022 | 0.294 | -0.055 | 0.463 | -0.052 | 0.276 |
| 2013-2014 | -0.088 | 0.294 | -0.099 | 0.442 | -0.335 | 0.082 | -0.084 | 0.359 |
| 2014-2015 | -0.091 | 0.225 | -0.192 | 0.224 | -0.559 | 0.001 | -0.054 | 0.283 |
| 2015-2016 | -0.102 | 0.179 | -0.235 | 0.205 | -0.014 | 0.387 | -0.049 | 0.268 |
| 2016-2017 | -0.061 | 0.367 | -0.035 | 0.291 | 0.002 | 0.352 | -0.047 | 0.241 |
| 2017-2018 | -0.075 | 0.437 | -0.045 | 0.430 | -0.041 | 0.421 | -0.097 | 0.192 |
| 2018-2019 | -0.092 | 0.263 | -0.407 | 0.043 | -0.407 | 0.043 | -0.040 | 0.191 |
| 2019-2020 | -0.076 | 0.431 | -0.625 | 0.000 | -0.576 | 0.001 | -0.025 | 0.066 |
| 2020-2021 | -0.083 | 0.314 | 0.006 | 0.306 | 0.047 | 0.214 | -0.065 | 0.417 |
| [1] | Ahmed N, Hamid Z, Mahboob F, et al. Causal linkage among agricultural insurance,air pollution,and agricultural green total factor productivity in United States:pairwise granger causality approach[J]. Agriculture, 2022, 12(9):1320. |
| [2] | 秦博, 范国华. 甘肃省农业绿色全要素生产率测算及影响因素研究[J]. 国土与自然资源研究, 2025,(1):59-65. |
| Qin Bo, Fan Guohua. Study on the Measurement and Influencing Factors of Agricultural Green Total Factor Productivity in Gansu Province[J]. Territory & Natural Resources Study, 2025, (1): 59-65. | |
| [3] | 许嘉伟, 王蕾, 许嘉豪. 农业绿色全要素生产率的时空分异研究——以长江经济带与黄河流域为例[J]. 湖北农业科学, 2024, 63(10):201-210. |
| XU Jia-wei, WANG Lei, XU Jia-hao, et al. Study on the spatial and temporal differentiation of agricultural green total factor productivity:Taking the Yangtze River Economic Belt and the Yellow River Basin as examples[J]. Hubei Agricultural Sciences, 2024, 63(10): 201-210. | |
| [4] | 杨格, 田逸飘. 云南农业绿色全要素生产率时空演变及影响因素分析[J]. 西南林业大学学报(社会科学), 2024, 8(04):54-61. |
| Yang Ge, Tian Yipiao. Dali University College of Economics and Management, Temporal and Spatial Evolution of Agricultural Green Total Factor Productivity and Its Influencing Factors in Yunnan Province[J]. Journal of Southwest Forestry University(Social Sciences), 2024, 8(04): 54-61. | |
| [5] | 罗杭春, 武家晖. 长江经济带农业绿色全要素生产率动态演变研究——基于SBM-GML指数测算的结果[J]. 农业与技术, 2024, 44(2):167-170. |
| LUO Hangchun, WU Jiahui. Study on the Dynamic Evolution of Agricultural Green Total Factor Productivity in the Yangtze River Economic Belt -- Results Based on SBM-GML Index Measurement[J]. Agriculture and Technology, 2024, 44(2): 167-170. | |
| [6] | 葛鹏飞, 王颂吉, 黄秀路. 中国农业绿色全要素生产率测算[J]. 中国人口·资源与环境, 2018, 28(5):66-74. |
| GE Pengfei, WANG Songji, HUANG Xiulu. Measurement for China's agricultural green TFP[J]. China Population, Resources and Environment, 2018, 28(5): 66-74. | |
| [7] | 解展镔, 肖红波, 曹暕. 中国畜牧业绿色全要素生产率时空演变特征——基于碳排放的非期望产出[J]. 中国家禽, 2025, 47(7):92-101. |
| XIE Zhanbin, XIAO Hongbo, CAO Jian. Temporal and Spatial Evolution Characteristics of Green Total Factor Productivity of Animal Husbandry in China -- on the Basis of Carbon Emissions as the Unexpected Output[J/OL]: China Poultry, 2025, 47(7): 92-101. | |
| [8] | 龚锐, 谢黎, 王亚飞. 农业高质量发展与新型城镇化的互动机理及实证检验[J]. 改革, 2020,(07):145-159. |
| GONG Rui, XIE Li, WANG Ya-fei. Interactive Mechanism and Empirical Test of Agricultural High-quality Development and New Urbanization[J]. Reform, 2020(07): 145-159. | |
| [9] | 郭菁菁, 熊冠琦, 黄映晖. 京津冀地区农业绿色全要素生产率实证分析[J/OL]. 农业展望, 2025, 21(2): 76-87. |
| Guo Jingjing, Xiong Guanqi, Huang Yinghui, et al. Empirical Analysis of Agricultural Green Total Factor Productivity in Beijing-Tianjin-Hebei Region[J]. Agricultural Outlook, 2025, 21(2): 76-87. | |
| [10] | West T O, Marland G. A synthesis of carbon sequestration,carbon emissions,and net carbon flux in agriculture:comparing tillage practices in the United States[J]. Agriculture,Ecosystems&Environment, 2002, 91(1-3): 217-232. |
| [11] | 田云, 张俊飚, 李波. 中国农业碳排放研究:测算、时空比较及脱钩效应[J]. 资源科学, 2012, 34(11):2097-2105. |
| TIAN Yun, ZHANG Junbiao, LI Bo. Agricultural Carbon Emissions in China: Calculation, Spatial-Temporal Comparison and Decoupling Effects[J]. Resources Science, 2012, 34(11): 2097-2105. | |
| [12] | 段华平, 张悦, 赵建波, 等. 中国农田生态系统的碳足迹分析[J]. 水土保持学报, 2011, 25(5):203-208. |
| Duan H P, Zhang Y, Zhao J B, Bian X M. Carbon footprint analysis of farmland ecosystem in China[J]. Soil and Water Conservation, 2011, 25(5): 203-208. | |
| [13] | 伍芬琳, 李琳, 张海林, 等. 保护性耕作对农田生态系统净碳释放量的影响[J]. 生态学杂志, 2007,(12):2035-2039. |
| WU Fenlin, LI Lin, ZHANG Hailin, et al. Effects of conservation tillage on net carbon flux from farmland ecosystems[J]. Chinese Journal of Ecology, 2007(12): 2035-2039. |
| [1] | LIN Jing, LI Yunyun, WANG Xiang, Rezia Maimaiti, Ainiwaer Maimaiti, Maiwulanjiang Maimaiti. Based on the Xinjiang agricultural science and technology journal "Rural Science and Technology", a study on the development of Xinjiang agricultural science and technology was conducted [J]. Xinjiang Agricultural Sciences, 2025, 62(S1): 247-252. |
| [2] | JIA Qiong, ZHANG Zhidong, GU Meiying, ZHANG Lijuan, WANG Ning, HUANG Wei, ZHU Jing. Research on the application status and promotion strategies of microbial agents in Xinjiang's characteristic agriculture [J]. Xinjiang Agricultural Sciences, 2025, 62(S1): 182-186. |
| [3] | Yierxiati Abulaiti, ZHENG Zipiao, WANG Liang, ZHANG Na, LI Jie, LIU Jia, LYU Qingqing, LIANG Fubin, FANG Yanfei, CUI Jianping, LIN Tao, GUO Rensong, TIAN Liwen, XU Haijiang, ZHANG Pengzhong. Sustainable smart cotton production in Xinjiang: current practices and future pathways [J]. Xinjiang Agricultural Sciences, 2025, 62(S1): 12-16. |
| [4] | ZHANG Qiong, WANG Fang, YUE Rongqiang, DENG Wenwen, CHEN Yu, MaiwulJiang Maimaiti, Nurmanguli Batur. Write papers on the land of our home country for the “agriculture, rural areas and farmers” and make our journal’s due contribution [J]. Xinjiang Agricultural Sciences, 2024, 61(S1): 245-250. |
| [5] | WANG Bing, GUO Jun, XU Shidong, JIANG Guowei, LI Yunyun, WANG Xiang, LI Qiongshi, DING Yuhong. Analysis of smart agriculture: technical progress and practical cases [J]. Xinjiang Agricultural Sciences, 2024, 61(S1): 238-244. |
| [6] | HOU Xianzheng, XIAO Tong, CHEN Yulan, WEI Jiyu. The spatial effects and mechanism of digital technology innovation on agricultural economic resilience [J]. Xinjiang Agricultural Sciences, 2024, 61(S1): 196-205. |
| [7] | XU Le, XIAO Hailong, ZHA Zhihao, YANG Haoran, LIU Tingting, CHEN Keke, DING Wanyue, WANG Penghao, Renaguli Yunusi. Analysis of the current situation of cooperation between research institutes and universities [J]. Xinjiang Agricultural Sciences, 2024, 61(S1): 186-190. |
| [8] | TIAN Conghua, MIAO Hongping, ZHANG Lizhao, DAI Jian. Construction of evaluation indicator system of agricultural High-Quality development based on international comparison [J]. Xinjiang Agricultural Sciences, 2024, 61(10): 2583-2592. |
| [9] | ZHAO Chenxiao, CHEN Yulan, ZHAO Dajun. Analysis on Green Production and Management Behavior of Cotton Farmers in Main Cotton Production Areas [J]. Xinjiang Agricultural Sciences, 2023, 60(3): 757-765. |
| [10] | GUO Hua, SHI Jialin, LI jin, SUN Guoxing, LIU Huixiang, YIN Chuan. Research on the Construction of Modern Agricultural Technology InnovationSystem and Its Development Countermeasures [J]. Xinjiang Agricultural Sciences, 2022, 59(1): 242-250. |
| [11] | XU Rui-qiang,DONG He-lin,XU Jiang-hui,TANG Jiang-hua,XU Wen-xiu, Kadiliya Avudukelimu,LI Da-ping,DONG Tai-lin,FU Chuan-cui. Effects of Different Amounts of Concentrated Biogas Slurry on Growth, Development and Photosynthetic Characteristics of Cotton [J]. Xinjiang Agricultural Sciences, 2018, 55(10): 1794-1802. |
| [12] | CHEN Xiao-li;XU Li. Study on the Efficiency of Rural Credit Rationing in Xinjiang [J]. , 2016, 53(9): 1758-1764. |
| [13] | . Survey of Facility Agricultural Resources in Kazakhstan [J]. , 2014, 51(4): 777-784. |
| [14] | LIANG Zhong-jie;CHEN Xia;MA Jian-jiang;WANG Yan-rong;SU Xiao-jun;LI Yong;MA De-ying. The Occurrence and Control of Earthworm in Facility Agriculture in Korla Region [J]. , 2014, 51(2): 257-263. |
| [15] | WANG Hao;MA Yue-hong;YANG Guan-yong;WANG Qiang;SONG Yu. Regional Distribution of Facility Agriculture Zone and Production Function Divisions in Xinjiang [J]. , 2014, 51(12): 2328-2337. |
| Viewed | ||||||
|
Full text |
|
|||||
|
Abstract |
|
|||||