
新疆农业科学 ›› 2024, Vol. 61 ›› Issue (11): 2825-2834.DOI: 10.6048/j.issn.1001-4330.2024.11.024
江应红1,2( ), 戴俊生1,3, 赵鑫3(), 刘易2, 宋玉兰1, 曹健1, 任红松2()
收稿日期:2024-04-07
出版日期:2024-11-20
发布日期:2025-01-08
通信作者:
赵鑫(1979-),女,新疆哈密人,研究员,硕士生导师,研究方向为农村区域发展,(E-mail)838977758@qq.com;作者简介:江应红(1988-),女,湖北天门人,硕士研究生,研究方向为蔬菜产业经济,(E-mail)593503532@qq.com
基金资助:
JIANG Yinghong1,2(), DAI Junsheng1,3, ZHAO Xin3(), LIU Yi2, SONG Yulan1, CAO Jian1, REN Hongsong2()
Received:2024-04-07
Published:2024-11-20
Online:2025-01-08
Supported by:摘要:
【目的】比较分析新疆各县(市)蔬菜生产的现状、区域比较优势及资源禀赋优势。【方法】采用集中度指数(CR)、规模比较优势指数(SAI)、效率比较优势指数(EAI)、综合比较优势指数(CAI)、资源禀赋系数(EF)方法,综合分析新疆各县(市)蔬菜生产集中度、区域比较优势及资源禀赋优势。【结果】2010~2020年新疆蔬菜生产总体平稳,面积基本稳定在25×104 hm2,产量1 300×104 t,单产50 t/ hm2以上。2020年形成了以和静县、莎车县、疏勒县、叶城县和焉耆县的5大主栽区,播种面积均在1×10⁴ hm2以上;产量以和静县、焉耆县和叶城县为三大主产区,产量均在70×104 t以上。集中度指数CR3、CR5、CR8分别为0.20、0.29和0.42;规模比较优势指数(SAI)博湖县、和静县、和硕县、焉耆县、乌鲁木齐市和吐鲁番市较高,依次为8.921、8.155、6.314、5.517、5.418和5.132;效率比较优势指数(EAI)库尔勒市、轮台县、玛纳斯县和尉犁县较高,依次为2.654、2.535、2.121和2.040;CAI结果为和静县、阜康市、焉耆县、喀什市和乌鲁木齐市较高,依次为3.151、2.772、2.498、2.302和2.163;资源禀赋(EF)博湖县、焉耆县、和静县和和硕县较高,依次为6.324、5.228、4.752和4.354。【结论】新疆蔬菜生产集中度较高,博湖县、和静县、和硕县、焉耆县、乌鲁木齐市和吐鲁番市规模比较优势较强;库尔勒市、轮台县、玛纳斯县和尉犁县效率比较优势较强;和静县、阜康市、焉耆县、喀什市和乌鲁木齐市综合比较优势较强。资源禀赋优势以博湖县、焉耆县、和静县及和硕县最为突出,其次为乌鲁木齐市、昌吉市、喀什市、阜康市、呼图壁县、伊宁市和吉木萨尔县。
中图分类号:
江应红, 戴俊生, 赵鑫, 刘易, 宋玉兰, 曹健, 任红松. 新疆蔬菜生产区域比较优势分析[J]. 新疆农业科学, 2024, 61(11): 2825-2834.
JIANG Yinghong, DAI Junsheng, ZHAO Xin, LIU Yi, SONG Yulan, CAO Jian, REN Hongsong. The regional comparative advantage of vegetable production in Xinjiang[J]. Xinjiang Agricultural Sciences, 2024, 61(11): 2825-2834.
| 年份 Year | 播种面积 Sown area (hm2) | 产量 Output (104 t) | 单产 Unit yield (t/hm2) |
|---|---|---|---|
| 2010 | 246 990 | 1 293.64 | 52.38 |
| 2012 | 258 560 | 1 315.6 | 50.88 |
| 2015 | 255 680 | 1 422.81 | 55.65 |
| 2017 | 249 200 | 1 437.71 | 57.69 |
| 2018 | 212 240 | 1 075.32 | 50.67 |
| 2020 | 243 780 | 1 233.55 | 50.60 |
表1 2010~2020年新疆蔬菜播种面积、产量和单产的变化
Tab.1 Changes of The sown area,output and unit yield of vegetable production in Xinjiang for some years from 2010 to 2020
| 年份 Year | 播种面积 Sown area (hm2) | 产量 Output (104 t) | 单产 Unit yield (t/hm2) |
|---|---|---|---|
| 2010 | 246 990 | 1 293.64 | 52.38 |
| 2012 | 258 560 | 1 315.6 | 50.88 |
| 2015 | 255 680 | 1 422.81 | 55.65 |
| 2017 | 249 200 | 1 437.71 | 57.69 |
| 2018 | 212 240 | 1 075.32 | 50.67 |
| 2020 | 243 780 | 1 233.55 | 50.60 |
| 排名 Ranking | 2010年 | 2015年 | 2020年 | |||
|---|---|---|---|---|---|---|
| 县(市) County(city) | 播种面积 Sown area | 县(市) County(city) | 播种面积 Sown area | 县(市) County(city) | 播种面积 Sown area | |
| 1 | 乌鲁木齐市 | 11 420 | 和硕县 | 13 640 | 和静县 | 16 860 |
| 2 | 沙湾市 | 10 260 | 乌鲁木齐市 | 13 570 | 莎车县 | 13 950 |
| 3 | 和静县 | 9 910 | 和静县 | 12 580 | 疏勒县 | 13 090 |
| 4 | 博湖县 | 9 230 | 博湖县 | 12 390 | 叶城县 | 12 670 |
| 5 | 和硕县 | 9 180 | 阜康市 | 9 650 | 焉耆县 | 12 640 |
| 6 | 叶城县 | 9 180 | 莎车县 | 8 830 | 和硕县 | 9 610 |
| 7 | 昌吉市 | 8 580 | 呼图壁县 | 8 790 | 和田县 | 9 090 |
| 8 | 疏附县 | 8 520 | 疏勒县 | 8 350 | 博湖县 | 8 690 |
| 9 | 莎车县 | 8 070 | 疏附县 | 8 110 | 喀什市 | 8 030 |
| 10 | 乌苏市 | 7 530 | 沙湾市 | 7 920 | 墨玉县 | 6 770 |
| 11 | 呼图壁县 | 7 500 | 焉耆县 | 7 650 | 吐鲁番市 | 6 610 |
| 12 | 喀什市 | 6 550 | 叶城县 | 7 480 | 拜城县 | 6 550 |
| 13 | 焉耆县 | 6 430 | 吐鲁番市 | 6 310 | 阜康市 | 5 990 |
| 14 | 吐鲁番市 | 6 290 | 昌吉市 | 6 210 | 昌吉市 | 5 790 |
| 15 | 拜城县 | 6 200 | 乌苏市 | 6 080 | 疏附县 | 5 650 |
| 16 | 玛纳斯县 | 5 920 | 喀什市 | 5 730 | 伽师县 | 5 520 |
| 17 | 吉木萨尔县 | 5 880 | 温宿县 | 5 610 | 于田县 | 5 460 |
| 18 | 疏勒县 | 5 690 | 奇台县 | 4 740 | 英吉沙县 | 5 440 |
| 19 | 伽师县 | 4 650 | 乌什县 | 3 810 | 洛浦县 | 5 160 |
| 20 | 阜康市 | 4 250 | 吉木萨尔县 | 3 760 | 乌苏市 | 5 050 |
表2 新疆蔬菜播种面积前20个县(市)的变化
Tab.2 The top 20 counties(cities) for vegetable sown area in Xinjiang(hm2)
| 排名 Ranking | 2010年 | 2015年 | 2020年 | |||
|---|---|---|---|---|---|---|
| 县(市) County(city) | 播种面积 Sown area | 县(市) County(city) | 播种面积 Sown area | 县(市) County(city) | 播种面积 Sown area | |
| 1 | 乌鲁木齐市 | 11 420 | 和硕县 | 13 640 | 和静县 | 16 860 |
| 2 | 沙湾市 | 10 260 | 乌鲁木齐市 | 13 570 | 莎车县 | 13 950 |
| 3 | 和静县 | 9 910 | 和静县 | 12 580 | 疏勒县 | 13 090 |
| 4 | 博湖县 | 9 230 | 博湖县 | 12 390 | 叶城县 | 12 670 |
| 5 | 和硕县 | 9 180 | 阜康市 | 9 650 | 焉耆县 | 12 640 |
| 6 | 叶城县 | 9 180 | 莎车县 | 8 830 | 和硕县 | 9 610 |
| 7 | 昌吉市 | 8 580 | 呼图壁县 | 8 790 | 和田县 | 9 090 |
| 8 | 疏附县 | 8 520 | 疏勒县 | 8 350 | 博湖县 | 8 690 |
| 9 | 莎车县 | 8 070 | 疏附县 | 8 110 | 喀什市 | 8 030 |
| 10 | 乌苏市 | 7 530 | 沙湾市 | 7 920 | 墨玉县 | 6 770 |
| 11 | 呼图壁县 | 7 500 | 焉耆县 | 7 650 | 吐鲁番市 | 6 610 |
| 12 | 喀什市 | 6 550 | 叶城县 | 7 480 | 拜城县 | 6 550 |
| 13 | 焉耆县 | 6 430 | 吐鲁番市 | 6 310 | 阜康市 | 5 990 |
| 14 | 吐鲁番市 | 6 290 | 昌吉市 | 6 210 | 昌吉市 | 5 790 |
| 15 | 拜城县 | 6 200 | 乌苏市 | 6 080 | 疏附县 | 5 650 |
| 16 | 玛纳斯县 | 5 920 | 喀什市 | 5 730 | 伽师县 | 5 520 |
| 17 | 吉木萨尔县 | 5 880 | 温宿县 | 5 610 | 于田县 | 5 460 |
| 18 | 疏勒县 | 5 690 | 奇台县 | 4 740 | 英吉沙县 | 5 440 |
| 19 | 伽师县 | 4 650 | 乌什县 | 3 810 | 洛浦县 | 5 160 |
| 20 | 阜康市 | 4 250 | 吉木萨尔县 | 3 760 | 乌苏市 | 5 050 |
| 排名 Ranking | 地(州市) Regions | 县(市) County(city) | 2010年面积 Sown area in 2010 (hm2) | 2020年面积 Sown area in 2020 (hm2) | 平均增减率 Average increasing range(%) |
|---|---|---|---|---|---|
| 1 | 和田地区 | 和田县 | 1.84 | 9.09 | 39.40 |
| 2 | 和田地区 | 洛浦县 | 1.39 | 5.16 | 27.12 |
| 3 | 阿克苏地区 | 沙雅县 | 0.85 | 2.96 | 24.82 |
| 4 | 阿克苏地区 | 温宿县 | 1.57 | 4.94 | 21.46 |
| 5 | 喀什地区 | 巴楚县 | 1.09 | 3.12 | 18.62 |
| 6 | 阿克苏地区 | 阿瓦提县 | 1.06 | 2.99 | 18.21 |
| 7 | 和田地区 | 墨玉县 | 2.78 | 6.77 | 14.35 |
| 8 | 喀什地区 | 疏勒县 | 5.69 | 13.09 | 13.01 |
| 9 | 和田地区 | 于田县 | 2.49 | 5.46 | 11.93 |
| 10 | 巴音郭楞蒙古自治州 | 焉耆县 | 6.43 | 12.64 | 9.66 |
| 11 | 阿克苏地区 | 库车市 | 2.66 | 4.94 | 8.57 |
| 12 | 喀什地区 | 莎车县 | 8.07 | 13.95 | 7.29 |
| 13 | 巴音郭楞蒙古自治州 | 和静县 | 9.91 | 16.86 | 7.01 |
| 14 | 喀什地区 | 麦盖提县 | 1.90 | 3.08 | 6.21 |
| 15 | 喀什地区 | 英吉沙县 | 3.37 | 5.44 | 6.14 |
| 16 | 昌吉回族自治州 | 阜康市 | 4.25 | 5.99 | 4.09 |
| 17 | 喀什地区 | 叶城县 | 9.18 | 12.67 | 3.80 |
| 18 | 喀什地区 | 喀什市 | 6.55 | 8.03 | 2.26 |
| 19 | 喀什地区 | 伽师县 | 4.65 | 5.52 | 1.87 |
| 20 | 阿克苏地区 | 拜城县 | 6.20 | 6.55 | 0.56 |
| 21 | 吐鲁番市 | 吐鲁番市 | 6.29 | 6.61 | 0.51 |
| 22 | 巴音郭楞蒙古自治州 | 和硕县 | 9.18 | 9.61 | 0.47 |
| 23 | 阿克苏地区 | 阿克苏市 | 3.99 | 4.02 | 0.08 |
| 24 | 和田地区 | 皮山县 | 2.98 | 2.96 | -0.07 |
| 25 | 巴音郭楞蒙古自治州 | 博湖县 | 9.23 | 8.69 | -0.59 |
| 26 | 昌吉回族自治州 | 昌吉市 | 8.58 | 5.79 | -3.25 |
| 27 | 塔城地区 | 乌苏市 | 7.53 | 5.05 | -3.29 |
| 28 | 喀什地区 | 疏附县 | 8.52 | 5.65 | -3.37 |
| 29 | 塔城地区 | 沙湾市 | 10.26 | 4.68 | -5.44 |
| 30 | 乌鲁木齐市 | 乌鲁木齐市 | 11.42 | 4.00 | -6.50 |
表3 新疆主要县(市)2010~2020年蔬菜播种面积平均增减率
Tab.3 Average increasing range of vegetable sown area in major counties and cities of Xinjiang from 2010 to 2020
| 排名 Ranking | 地(州市) Regions | 县(市) County(city) | 2010年面积 Sown area in 2010 (hm2) | 2020年面积 Sown area in 2020 (hm2) | 平均增减率 Average increasing range(%) |
|---|---|---|---|---|---|
| 1 | 和田地区 | 和田县 | 1.84 | 9.09 | 39.40 |
| 2 | 和田地区 | 洛浦县 | 1.39 | 5.16 | 27.12 |
| 3 | 阿克苏地区 | 沙雅县 | 0.85 | 2.96 | 24.82 |
| 4 | 阿克苏地区 | 温宿县 | 1.57 | 4.94 | 21.46 |
| 5 | 喀什地区 | 巴楚县 | 1.09 | 3.12 | 18.62 |
| 6 | 阿克苏地区 | 阿瓦提县 | 1.06 | 2.99 | 18.21 |
| 7 | 和田地区 | 墨玉县 | 2.78 | 6.77 | 14.35 |
| 8 | 喀什地区 | 疏勒县 | 5.69 | 13.09 | 13.01 |
| 9 | 和田地区 | 于田县 | 2.49 | 5.46 | 11.93 |
| 10 | 巴音郭楞蒙古自治州 | 焉耆县 | 6.43 | 12.64 | 9.66 |
| 11 | 阿克苏地区 | 库车市 | 2.66 | 4.94 | 8.57 |
| 12 | 喀什地区 | 莎车县 | 8.07 | 13.95 | 7.29 |
| 13 | 巴音郭楞蒙古自治州 | 和静县 | 9.91 | 16.86 | 7.01 |
| 14 | 喀什地区 | 麦盖提县 | 1.90 | 3.08 | 6.21 |
| 15 | 喀什地区 | 英吉沙县 | 3.37 | 5.44 | 6.14 |
| 16 | 昌吉回族自治州 | 阜康市 | 4.25 | 5.99 | 4.09 |
| 17 | 喀什地区 | 叶城县 | 9.18 | 12.67 | 3.80 |
| 18 | 喀什地区 | 喀什市 | 6.55 | 8.03 | 2.26 |
| 19 | 喀什地区 | 伽师县 | 4.65 | 5.52 | 1.87 |
| 20 | 阿克苏地区 | 拜城县 | 6.20 | 6.55 | 0.56 |
| 21 | 吐鲁番市 | 吐鲁番市 | 6.29 | 6.61 | 0.51 |
| 22 | 巴音郭楞蒙古自治州 | 和硕县 | 9.18 | 9.61 | 0.47 |
| 23 | 阿克苏地区 | 阿克苏市 | 3.99 | 4.02 | 0.08 |
| 24 | 和田地区 | 皮山县 | 2.98 | 2.96 | -0.07 |
| 25 | 巴音郭楞蒙古自治州 | 博湖县 | 9.23 | 8.69 | -0.59 |
| 26 | 昌吉回族自治州 | 昌吉市 | 8.58 | 5.79 | -3.25 |
| 27 | 塔城地区 | 乌苏市 | 7.53 | 5.05 | -3.29 |
| 28 | 喀什地区 | 疏附县 | 8.52 | 5.65 | -3.37 |
| 29 | 塔城地区 | 沙湾市 | 10.26 | 4.68 | -5.44 |
| 30 | 乌鲁木齐市 | 乌鲁木齐市 | 11.42 | 4.00 | -6.50 |
| 年份 Year | CR3 | CR5 | CR8 |
|---|---|---|---|
| 2010 | 0.17 | 0.25 | 0.38 |
| 2011 | 0.17 | 0.26 | 0.37 |
| 2012 | 0.15 | 0.24 | 0.36 |
| 2013 | 0.17 | 0.26 | 0.37 |
| 2014 | 0.17 | 0.27 | 0.39 |
| 2015 | 0.19 | 0.28 | 0.40 |
| 2016 | 0.19 | 0.28 | 0.40 |
| 2017 | 0.18 | 0.27 | 0.40 |
| 2018 | 0.21 | 0.32 | 0.45 |
| 2019 | 0.21 | 0.32 | 0.45 |
| 2020 | 0.20 | 0.29 | 0.42 |
表4 2010~2020年新疆蔬菜生产集中度指数
Tab.4 The industry concentration of Xinjiang vegetables from 2010 to 2020
| 年份 Year | CR3 | CR5 | CR8 |
|---|---|---|---|
| 2010 | 0.17 | 0.25 | 0.38 |
| 2011 | 0.17 | 0.26 | 0.37 |
| 2012 | 0.15 | 0.24 | 0.36 |
| 2013 | 0.17 | 0.26 | 0.37 |
| 2014 | 0.17 | 0.27 | 0.39 |
| 2015 | 0.19 | 0.28 | 0.40 |
| 2016 | 0.19 | 0.28 | 0.40 |
| 2017 | 0.18 | 0.27 | 0.40 |
| 2018 | 0.21 | 0.32 | 0.45 |
| 2019 | 0.21 | 0.32 | 0.45 |
| 2020 | 0.20 | 0.29 | 0.42 |
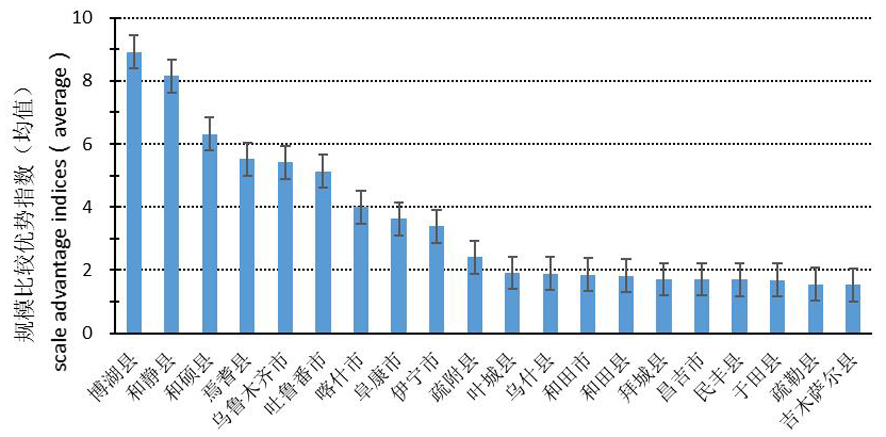
图1 2010~2020年新疆蔬菜生产规模比较优势指数(均值)排名前20的县(市)
Fig.1 The top 20 counties(cities)for vegetable production of SAI(average) in Xinjiang from 2010 to 2020
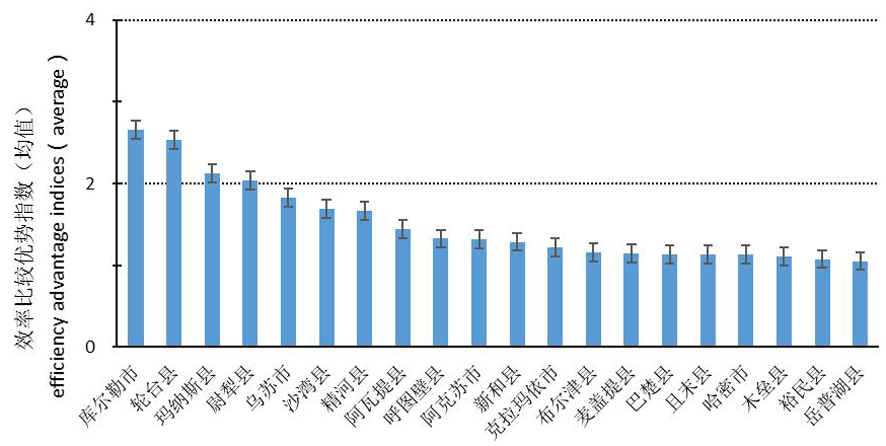
图2 2010~2020年新疆蔬菜生产效率比较优势指数(均值)排名前20县(市)
Fig.2 The top 20 counties(cities)for vegetable production of EAI(average) in Xinjiang from 2010 to 2020
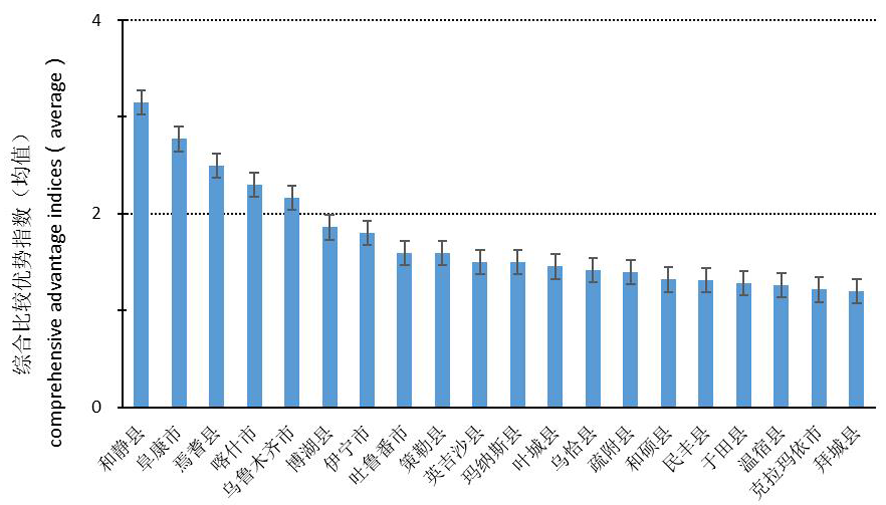
图3 2010~2020年新疆蔬菜生产综合比较优势指数(均值)排名前20的县(市)
Fig.3 The top 20 counties(cities)for vegetable production of CAI(average) in Xinjiang from 2010 to 2020
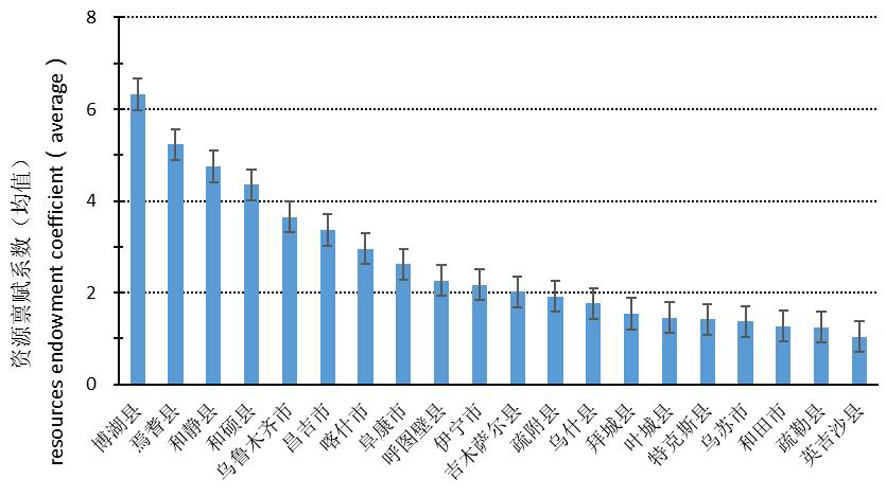
图4 2010~2020年新疆蔬菜生产资源禀赋系数(均值)排名前20的县(市)
Fig.4 The top 20 counties(cities)for vegetable production of EF(average) in Xinjiang from 2010 to 2020
| [1] | 陈卓群. 中国对RCEP国家蔬菜产品出口影响因素研究[D]. 沈阳: 辽宁大学, 2023. |
| CHEN Zhuoqun. Research on the Influencing Factors of China’s Export of Vegetable Products to RCEP Countries[D]. Shenyang: Liaoning University, 2023. | |
| [2] | 金珏雯, 穆月英. 中国蔬菜出口贸易的空间关联与溢出效应——基于“一带一路” 框架的实证[J]. 中国农业资源与区划, 2021, 42(6): 6-15. |
| JIN Juewen, MU Yueying. Spatial correlation and spillover effect of China’s vegetable export trade—an empirical study based on the “the Belt and Road initiative” framework[J]. Chinese Journal of Agricultural Resources and Regional Planning, 2021, 42(6): 6-15. | |
| [3] | 汪思婷. 环境约束下中国蔬菜生产效率及影响因素研究[D]. 扬州: 扬州大学, 2020. |
| WANG Siting. Study on Vegetable Production Efficiency and Influencing Factors under Environmental Constraints in China[D]. Yangzhou: Yangzhou University, 2020. | |
| [4] | 李哲敏, 任育锋, 张小允. 改革开放以来中国蔬菜产业发展及趋势[J]. 中国农业资源与区划, 2018, 39(12): 13-20. |
| LI Zhemin, REN Yufeng, ZHANG Xiaoyun. Development and trend of vegetable industry in China since reform and opening-up[J]. Chinese Journal of Agricultural Resources and Regional Planning, 2018, 39(12): 13-20. | |
| [5] | 张磊, 王娜, 吴金超. 中国蔬菜批发行业结构、行为及绩效研究——以山东寿光到北京的蔬菜流通为例[J]. 农业经济问题, 2018, 39(2): 115-126. |
| ZHANG Lei, WANG Na,WU Jinchao. Study on the structure, behavior and performance of vegetable wholesale industry in China: taking vegetables circulation from Shouguang Shandong to Beijing as an example[J]. Issues in Agricultural Economy, 2018, 39(2): 115-126. | |
| [6] | 钟鑫, 张忠明. 我国蔬菜生产区域特征及比较优势研究[J]. 中国食物与营养, 2014, 20(6): 24-28. |
| ZHONG Xin,ZHANG Zhongming. Study on regional characteristics and comparative advantage of vegetable production in China[J]. Food and Nutrition in China, 2014, 20(6): 24-28. | |
| [7] |
于丽艳, 穆月英. 中国蔬菜生产的时空变迁与比较优势分析[J]. 新疆农业科学, 2019, 56(10): 1948-1958.
DOI |
|
YU Liyan, MU Yueying. Analysis of the temporal and spatial changes and comparative advantages of vegetable production in China[J]. Xinjiang Agricultural Sciences, 2019, 56(10): 1948-1958.
DOI |
|
| [8] | 何婉, 樊斌, 李明阳. 中国蔬菜生产的集聚对技术效率的影响[J]. 北方园艺, 2023,(18): 142-149. |
| HE Wan, FAN Bin,LI Mingyang. Effects of agglomeration on technical efficiency of vegetable production in China[J]. Northern Horticulture, 2023,(18): 142-149. | |
| [9] | 毛昭庆, 董晓波, 陈良正, 等. 中国与澜湄五国蔬菜产业国际竞争力比较实证分析[J]. 江西农业学报, 2022, 34(4): 238-246. |
| MAO Zhaoqing, DONG Xiaobo, CHEN Liangzheng, et al. Comparative empirical analysis of international competitiveness of vegetable industry between China and five Lancang-Mekong countries[J]. Acta Agriculturae Jiangxi, 2022, 34(4): 238-246. | |
| [10] | 李佳敏, 何伟. 中国蔬菜国际竞争力分析[J]. 农业展望, 2021, 17(11): 80-86. |
| LI Jiamin, HE Wei. Analysis on the international competitiveness of Chinese vegetables[J]. Agricultural Outlook, 2021, 17(11): 80-86. | |
| [11] | 辛竹琳, 崔彦娟, 杨小薇, 等. 全球蔬菜产业现状及中国蔬菜育种发展路径研究进展[J]. 分子植物育种, 2022, 20(9): 3122-3132. |
| XIN Zhulin, CUI Yanjuan, YANG Xiaowei, et al. Current situation of global vegetable industry and research progress of vegetable breeding development path in China[J]. Molecular Plant Breeding, 2022, 20(9): 3122-3132. | |
| [12] | 赵婷, 张吉国. 山东蔬菜生产的区域比较优势分析[J]. 科技和产业, 2016, 16(1): 17-21. |
| ZHAO Ting, ZHANG Jiguo. Analysis of regional comparative advantage of vegetable production in Shandong[J]. Science Technology and Industry, 2016, 16(1): 17-21. | |
| [13] | 张玉鑫, 潘新, 高军, 等. 甘肃省蔬菜比较优势区域差异分析[J]. 甘肃农业科技, 2019,(8): 17-26. |
| ZHANG Yuxin, PAN Xin, GAO Jun, et al. Analysis of differences of vegetables' regional comparative advantage in Gansu Province[J]. Gansu Agricultural Science and Technology, 2019,(8): 17-26. | |
| [14] |
毛昭庆, 李梁, 陈良正, 等. 云南蔬菜生产的区域比较优势分析[J]. 农学学报, 2022, 12(1): 90-100.
DOI |
|
MAO Zhaoqing, LI Liang, CHEN Liangzheng, et al. The regional comparative advantages of vegetable production in Yunnan Province[J]. Journal of Agriculture, 2022, 12(1): 90-100.
DOI |
|
| [15] | 徐满意, 唐小付, 任昊奎, 等. 广西蔬菜产业的区域比较及竞争力分析[J]. 中国蔬菜, 2023,(8): 6-13. |
| XU Manyi, TANG Xiaofu, REN Haokui, et al. Regional comparison of vegetable industry in Guangxi and analysis for its competitiveness[J]. China Vegetables, 2023,(8): 6-13. | |
| [16] | 张文娟. 安徽省蔬菜生产区域比较优势及其影响因素研究[D]. 合肥: 安徽农业大学, 2022. |
| ZHANG Wenjuan. Study on Regional Comparative Advantages and Influencing Factors of Vegetable Production in Anhui Province[D]. Hefei: Anhui Agricultural University, 2022. | |
| [17] | 张权月, 王竞娴, 吴一平. 河南省蔬菜比较优势区域差异分析[J]. 蔬菜, 2021,(10): 33-41. |
| ZHANG Quanyue, WANG Jingxian, WU Yiping. Analysis on regional difference of vegetable comparative advantage in Henan Province[J]. Vegetables, 2021,(10): 33-41. | |
| [18] | 许红军, 秦勇, 吴慧, 等. 新疆蔬菜产业现状及发展对策[J]. 中国蔬菜, 2016,(9): 8-11. |
| XU Hongjun, QIN Yong, WU Hui, et al. Present situation and development countermeasures of vegetable industry in Xinjiang[J]. China Vegetables, 2016,(9): 8-11. | |
| [19] | 宋群. 南疆四地州设施蔬菜栽培制度中的问题及解决对策[D]. 石河子: 石河子大学, 2019. |
| SONG Qun. Problems of Cultivation System of Greenhouse Vegetables in the Four Prefectures of the South of Xinjiang Autonomous Region and Solutions[D]. Shihezi: Shihezi University, 2019. | |
| [20] | 江铮. 新疆蔬菜种苗产业发展问题及对策[J]. 西北园艺(综合), 2018,(3): 9-10. |
| JIANG Zheng. Problems and countermeasures of vegetable seedling industry development in Xinjiang[J]. Northwest Horticulture, 2018,(3): 9-10. | |
| [21] | 李凤, 李鹏. 新疆蔬菜市场消费特征及潜力预测研究[J]. 内蒙古农业科技, 2013, 41(1): 32-33, 35. |
| LI Feng, Li Peng. Consumption characteristics of vegetable market in Xinjiang and its potential prediction[J]. Inner Mongolia Agricultural Science and Technology, 2013, 41(1): 32-33, 35. | |
| [22] | 薛志刚, 刘英杰, 雷钧. 新疆蔬菜产业发展与价格波动的现状与对策[J]. 中国农学通报, 2011, 27(28): 263-268. |
| XUE Zhigang, LIU Yingjie, LEI Jun. Current situation and countermeasures ofVegetable industry and price fluctuation in Xinjiang[J]. Chinese Agricultural Science Bulletin, 2011, 27(28): 263-268. | |
| [23] | 韩青, 田聪. 新疆生鲜蔬菜质量安全现状与改进对策[J]. 黑龙江农业科学, 2016,(1): 123-125. |
| HAN Qing, TIAN Cong. Status of fresh vegetables quality and safety and the improved countermeasures in Xinjiang[J]. Heilongjiang Agricultural Sciences, 2016,(1): 123-125. | |
| [24] | 罗瑞峰. 新疆蔬菜农药残留现状分析及控制措施研究[D]. 石河子: 石河子大学, 2013. |
| LUO Ruifeng. Establish Monitoring System and Status Quo on Pesticide Residues in Vegetables of Xinjiang[D]. Shihezi: Shihezi University, 2013. | |
| [25] | 刘多红, 李艳军, 张斌, 等. 南疆设施农业发展现状、优势及可持续发展对策研究——以和田地区为例[J]. 蔬菜, 2021,(9): 36-40. |
| LIU Duohong, LI Yanjun, ZHANG Bin, et al. Study on the development status, advantages and sustainable development countermeasures of facility agriculture in southern Xinjiang—taking Hotan prefecture As an example[J]. Vegetables, 2021,(9): 36-40. | |
| [26] | 张凯芳. 吐鲁番市蔬菜在乌鲁木齐市场的直销模式研究[D]. 乌鲁木齐: 新疆农业大学, 2017. |
| ZHANG Kaifang. Study on Direct Distribution Mode of Vegetables Planted in Turpan But Sold in Urumqi Market[D]. Urumqi: Xinjiang Agricultural University, 2017. | |
| [27] | 周林荣, 关晓溪, 张新. 基于比较优势指数法的贵州省区域茶叶产业发展形势与竞争力分析[J]. 茶叶通讯, 2020, 47(1): 128-134. |
| ZHOU Linrong, GUAN Xiaoxi, ZHANG Xin. Analysis on the development situation and competitiveness of regional tea industry in Guizhou Province based on comparative advantage index[J]. Journal of Tea Communication, 2020, 47(1): 128-134. | |
| [28] | 肖海峰, 俞岩秀. 中国棉花生产布局变迁及其比较优势分析[J]. 农业经济与管理, 2018,(4): 38-47. |
| XIAO Haifeng, YU Yanxiu. Layout of cotton production and its comparative advantage in China[J]. Agricultural Economics and Management, 2018,(4): 38-47. | |
| [29] | 李红霞, 汤瑛芳, 沈慧. 甘肃马铃薯省域竞争力分析[J]. 干旱区资源与环境, 2019, 33(8): 36-41. |
| LI Hongxia, TANG Yingfang, SHEN Hui. Analysis on provincial competitiveness of potato in Gansu Province[J]. Journal of Arid Land Resources and Environment, 2019, 33(8): 36-41. | |
| [30] | 向云, 祁春节. 新疆水果生产的区域比较优势分析[J]. 干旱区资源与环境, 2015, 29(10): 152-158. |
| XIANG Yun,QI Chunjie. The regional comparative advantages of fruit production in Xinjiang[J]. Journal of Arid Land Resources and Environment, 2015, 29(10): 152-158. |
| [1] | 邓雯文, 岳荣强, 张琼, 王芳, 陈宇, 摆晶, 李志, 蒋国伟, 赵鑫, 苏武峥. 乌鲁木齐市五大蔬菜流通消费市场的现状及变化趋势分析[J]. 新疆农业科学, 2024, 61(S1): 168-174. |
| [2] | 马艳, 肖林刚, 喻晨, 郭兆峰, 邹平, 曹新伟. 设施蔬菜LED补光技术研究进展[J]. 新疆农业科学, 2024, 61(11): 2835-2843. |
| [3] | 张泓, 吐尔逊江·买买提, 张少民, 张军高, 周小云. 近30 a全国棉花生产区域时空变化及区域优势分析[J]. 新疆农业科学, 2023, 60(4): 1028-1040. |
| [4] | 杨征鹤, 杨会民, 喻晨, 陈毅飞, 周欣, 马艳, 王学农. 设施蔬菜自动对靶喷药技术研究现状与分析[J]. 新疆农业科学, 2021, 58(8): 1547-1557. |
| [5] | 于丽艳, 穆月英. 中国蔬菜生产的时空变迁与比较优势分析[J]. 新疆农业科学, 2019, 56(10): 1948-1958. |
| [6] | 邹淑萍, 孟伊娜, 张健, 马燕, 许铭强, 张谦. 太阳能干燥装置对四种蔬菜干制效果的影响研究[J]. 新疆农业科学, 2017, 54(8): 1505-1512. |
| [7] | 张鑫, 王文卿, 靳改龙, 张祥, 马德英. 两种烟熏剂对设施蔬菜上烟粉虱及海氏桨角蚜小蜂(Eretmocerus hayati)的毒力测定[J]. 新疆农业科学, 2017, 54(8): 1469-1474. |
| [8] | 王野;孙东升. 新疆主要农作物比较优势分析——基于国内资源成本法[J]. , 2015, 52(8): 1555-1562. |
| [9] | 陈丹;张以和;热孜万古力;米日古丽;杨媚;潘卫萍;马德英. 黄板诱杀对设施蔬菜烟粉虱控制作用研究[J]. , 2012, 49(2): 255-260. |
| [10] | 吐尔逊;吴静;郭文超;关志坚;李翠梅;艾尔肯·麦麦提;张振宇. 不同药剂防治设施蔬菜主要害虫温室白粉虱的防效[J]. , 2011, 48(2): 356-359. |
| [11] | 吾玛尔·阿布力孜;孜比尔妮莎·吾布力;阿布都如苏力·吐孙. 乌鲁木齐市蔬菜地土壤动物群落结构特征的初步研究[J]. , 2010, 47(7): 1441-1449. |
| [12] | 马萍;林成;李疆. 剖析新疆蔬菜种子质量投诉中的不完全春化现象[J]. , 2010, 47(7): 1320-1323. |
| [13] | 李瑜;廖新福;王惠林. 航天育种及其在蔬菜作物上的应用[J]. , 2007, 44(z2): 11-15. |
| [14] | 艾尼瓦尔·斯地克;瓦哈甫·哈力克. 新疆农产品贸易优势比较分析[J]. , 2007, 44(2): 217-221. |
| [15] | 帕尔哈提·克依木;张红艳;王成;田新玲;肖英;谢新民. 乌鲁木齐市郊区部分蔬菜基地土壤重金属含量及评价[J]. , 2007, 44(1): 99-101. |
| 阅读次数 | ||||||
|
全文 |
|
|||||
|
摘要 |
|
|||||