
新疆农业科学 ›› 2024, Vol. 61 ›› Issue (4): 1029-1040.DOI: 10.6048/j.issn.1001-4330.2024.04.028
• 植物保护·微生物·农业装备工程与机械化 • 上一篇
董兆森1( ), 张佳喜1,3(), 周欣2, 罗文杰2, 蒋永新2, 郭刚1
收稿日期:2023-08-09
出版日期:2024-04-20
发布日期:2024-05-31
通信作者:
张佳喜(1973-),男,陕西榆林人,教授,博士,硕士生/博士生导师,研究方向为循环农业技术,(E-mail)563810112@qq.com作者简介:董兆森(1997-),男,山东菏泽人,硕士研究生,研究方向为农业电气化与自动化,(E-mail)374587924@qq.com
基金资助:
DONG Zhaosen1(), ZHANG Jiaxi1,3(), ZHOU Xin2, LUO Wenjie2, JIANG Yongxin2, GUO Gang1
Received:2023-08-09
Published:2024-04-20
Online:2024-05-31
Correspondence author:
ZHANG Jiaxi (1973-), male,from Yulin, Shaanxi, professor, Ph.D.,doctoral supervisor, research direction: circular agricultural technology, (E-mail)563810112@qq.comSupported by:摘要:
【目的】测量滚筒式残膜回收机中的主要部件松土齿耙在作业过程中监测系统装置的应力应变状况,为提高残膜回收机工作效率、降低松土齿耙的故障率提供参考。【方法】设计松土齿耙应力应变监测系统,通过ANSYS分析确定监测点,采用DH5922N数据分析仪标定传感器,采集模块对松土齿的微小变形进行应力应变测量,连续监测松土齿应力应变数据,并针对松土齿耙壅土过载工况下提前预警。【结果】应力应变监测系统可以有效的对松土齿耙应力应变实时监测,模拟机具田间作业工况,轻度过载阈值为140 Mpa,严重过载阈值为180 Mpa,监测结果整体平均相对误差为10.12%,过载阈值设置可提前预警。【结论】松土齿耙应力应变监测系统主要由微处理器、应力应变采集模块、AD模数转换模块、电源模块、通讯模块、云平台可视化界面6部分组成,可实时监测松土齿耙的应力应变作业状况。
中图分类号:
董兆森, 张佳喜, 周欣, 罗文杰, 蒋永新, 郭刚. 基于无线通讯技术的松土装置应力应变监测系统设计与试验[J]. 新疆农业科学, 2024, 61(4): 1029-1040.
DONG Zhaosen, ZHANG Jiaxi, ZHOU Xin, LUO Wenjie, JIANG Yongxin, GUO Gang. Design and experiment of stress and strain monitoring system for soil loosening device based on wireless communication technology[J]. Xinjiang Agricultural Sciences, 2024, 61(4): 1029-1040.
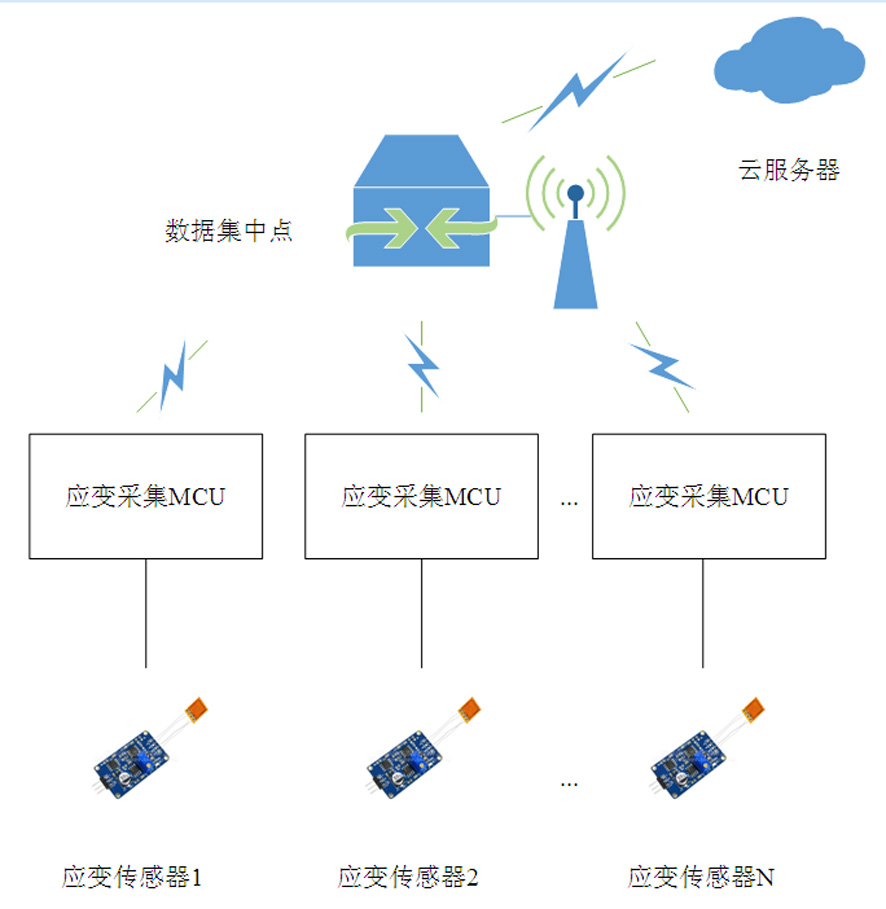
图1 松土齿应变监测系统总体结构
Fig.1 Overall structure of strain monitoring system for soil loosening teeth

图2 试验现场
Fig.2 Test site
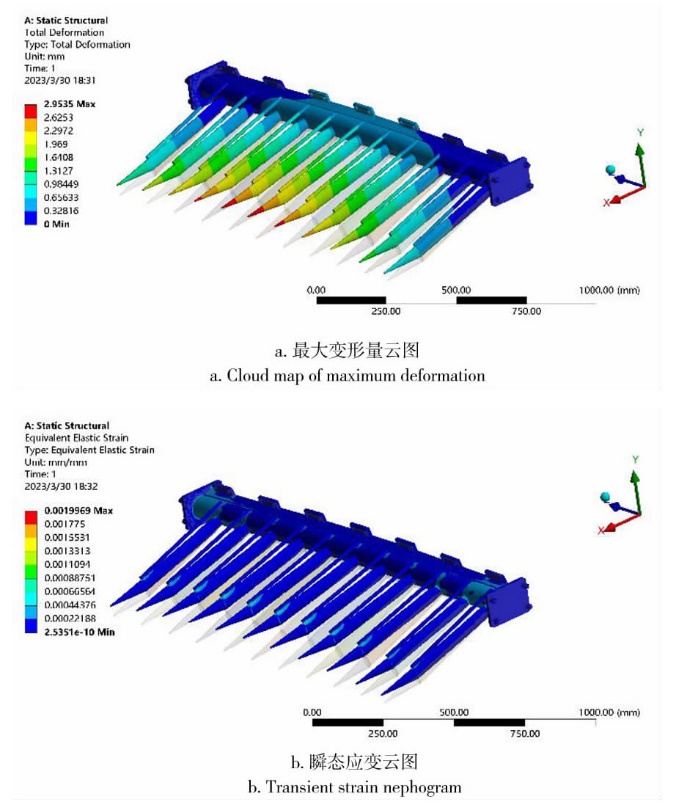
图3 松土齿耙静力学
Fig.3 Modal analysis of soil rake
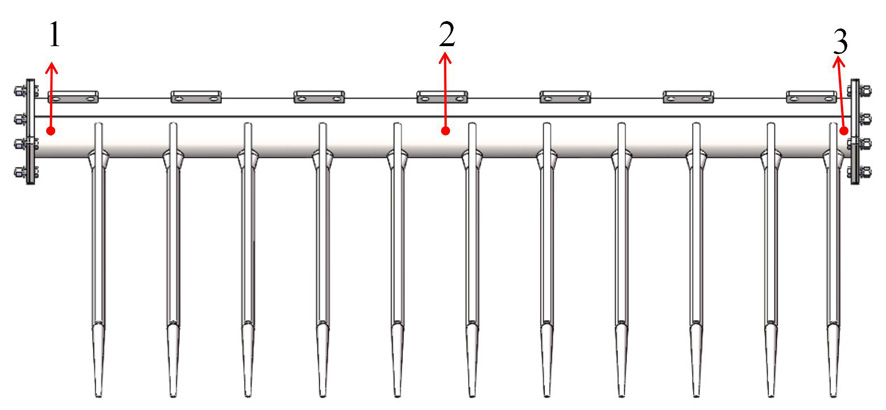
图4 松土齿耙监测位置示意
Fig.4 Schematic diagram of the monitoring position of the pine tooth rake
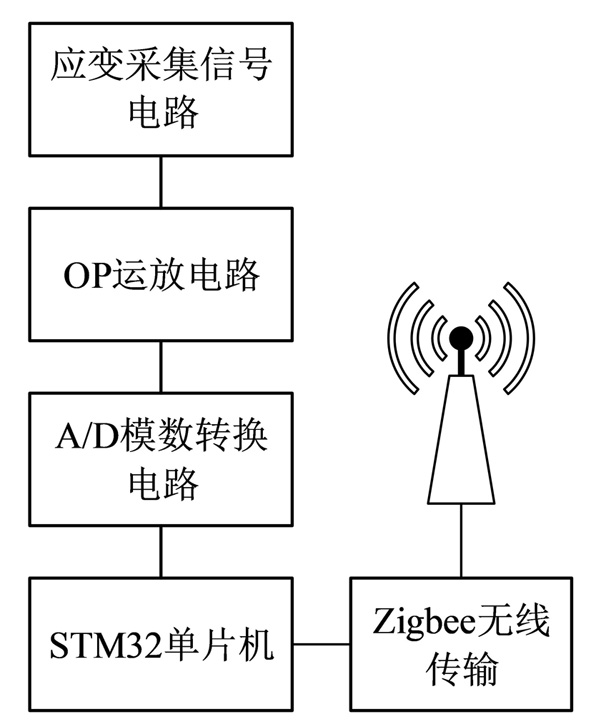
图5 应力应变采集模块
Fig.5 Strain monitoring unit
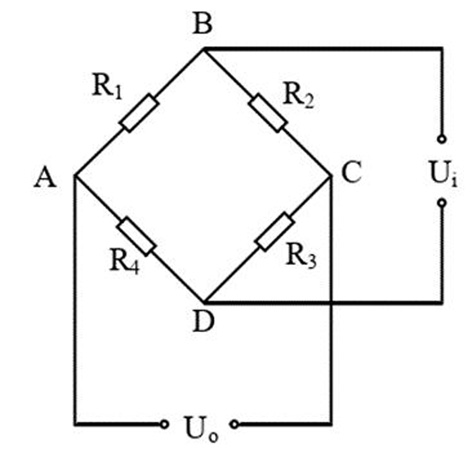
图6 惠斯通电桥测量电路
Fig.6 Wheatstone bridge measurement circuit
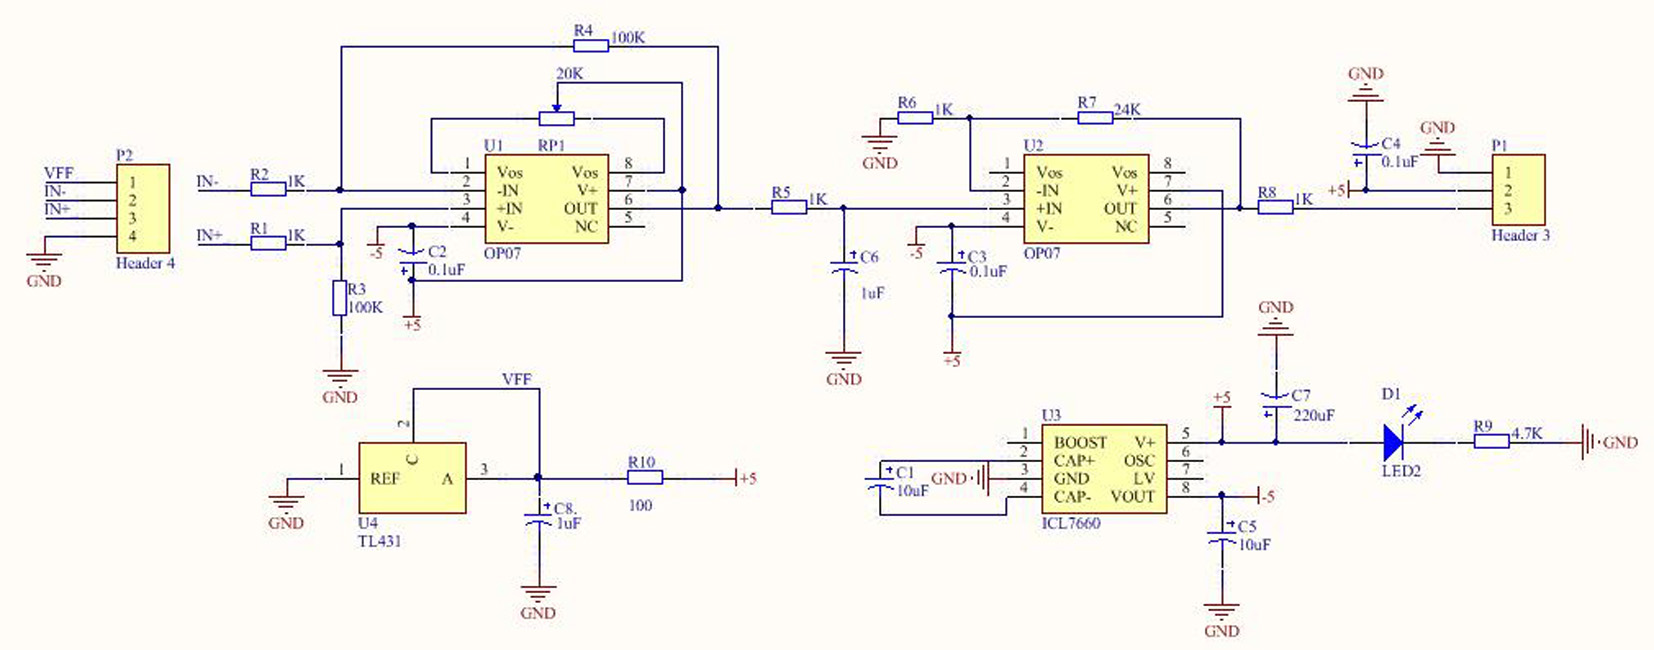
图7 应变采集电路
Fig.7 Strain collecting circuit
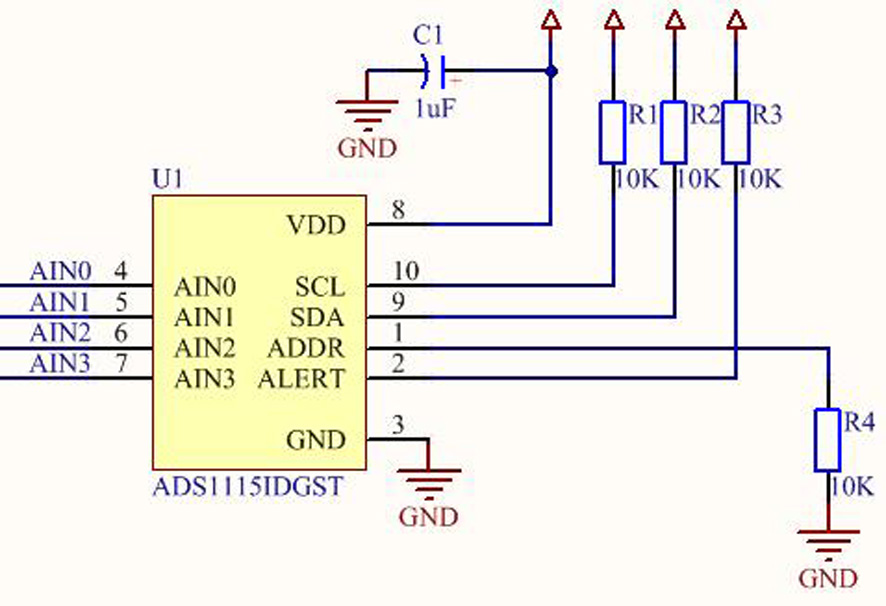
图8 ADS1115
Fig.8 ADS1115
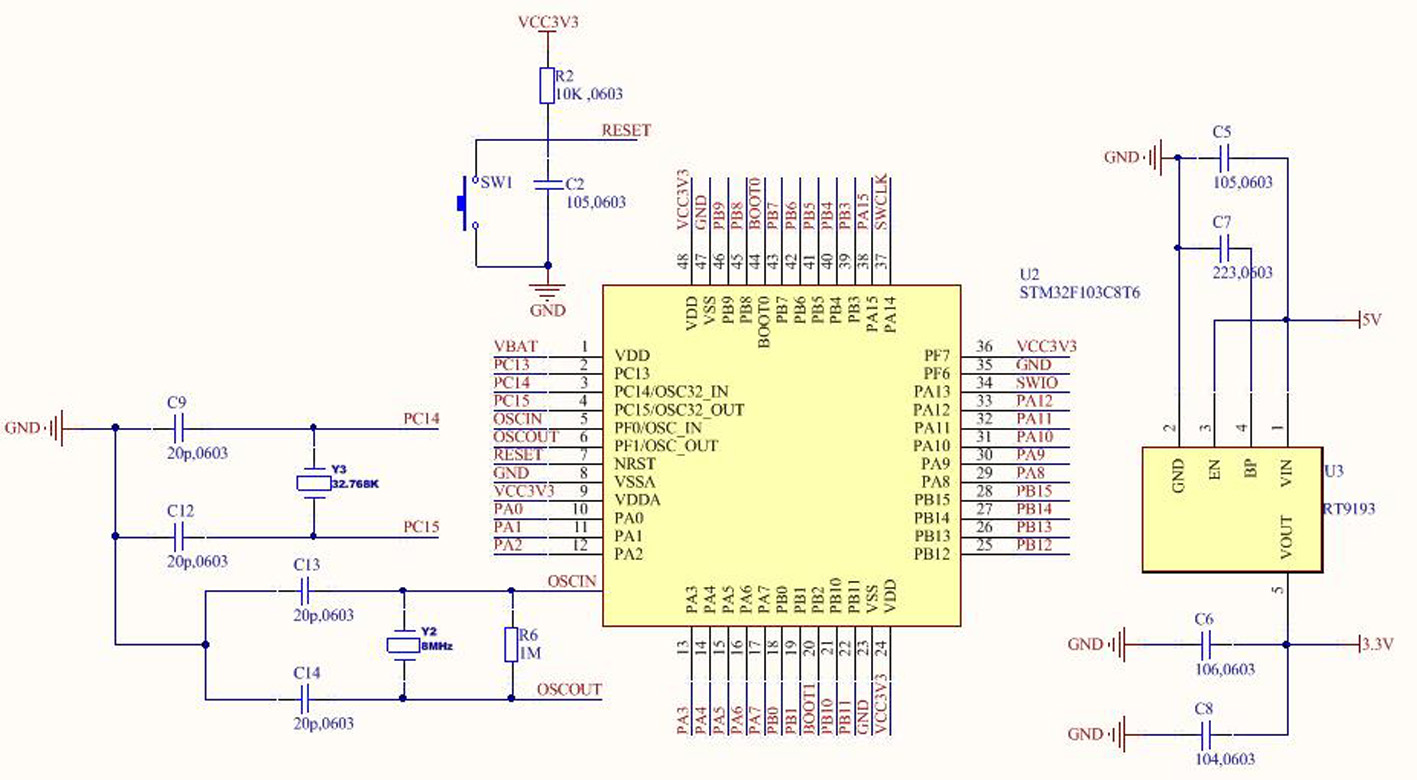
图9 微控制器原理
Fig.9 Schematic diagram of microcontroller
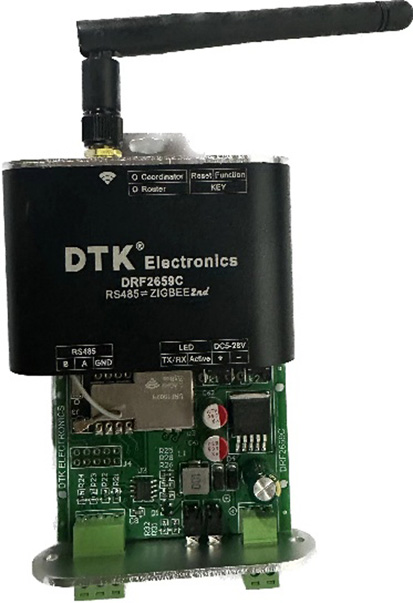
图10 DRF2659C
Fig.10 Schematic diagram of microcontroller
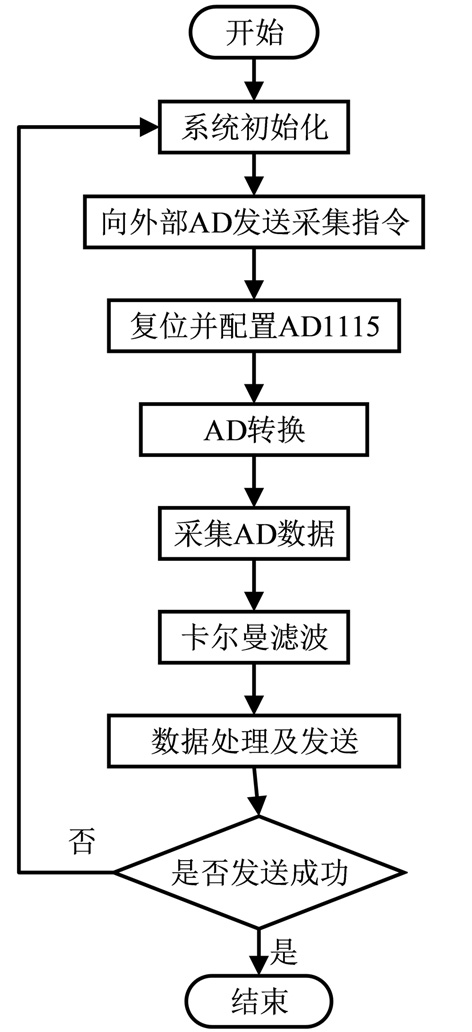
图11 应力应变采集程序流程
Fig.11 Flowchart of AD acquisition program
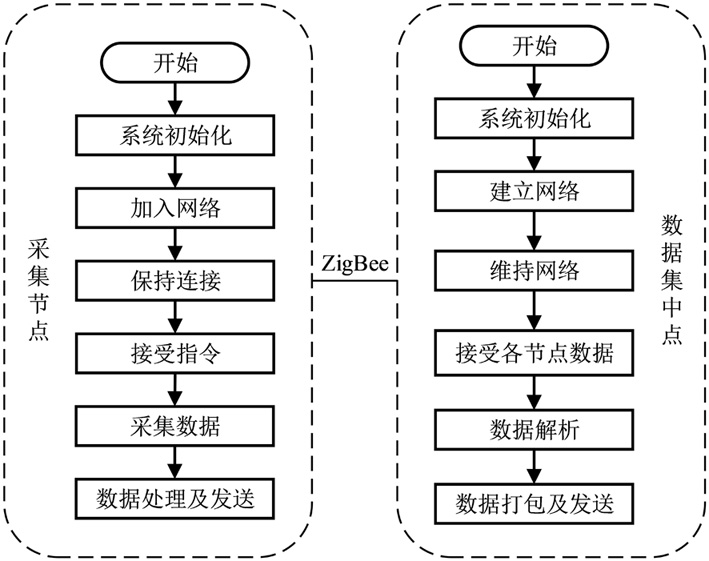
图12 无线传输网络程序
Fig.12 Wireless transmission network program
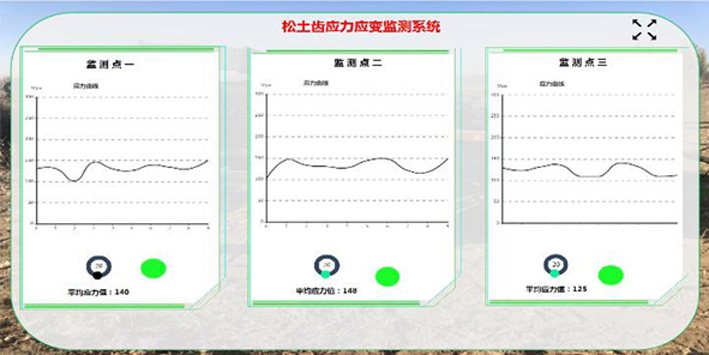
图13 云平台可视化界面
Fig.13 Cloud platform visual interface
| 序号 Serial number | 发送数据包 Send packet | 接收数据包 Receiving packet | 丢包率 Packet loss rate (%) |
|---|---|---|---|
| 1 | 2 000 | 2 000 | 0 |
| 2 | 2 000 | 1 998 | 0.1 |
| 3 | 2 000 | 1 999 | 0.05 |
| 4 | 2 000 | 2 000 | 0 |
| 5 | 2 000 | 1 999 | 0.05 |
表1 丢包率测试
Tab.1 Packet loss rate test
| 序号 Serial number | 发送数据包 Send packet | 接收数据包 Receiving packet | 丢包率 Packet loss rate (%) |
|---|---|---|---|
| 1 | 2 000 | 2 000 | 0 |
| 2 | 2 000 | 1 998 | 0.1 |
| 3 | 2 000 | 1 999 | 0.05 |
| 4 | 2 000 | 2 000 | 0 |
| 5 | 2 000 | 1 999 | 0.05 |
| 试验因素 Test factor | 入土深度 Buried depth (cm) | 前进速度 Forward speed (m/s) |
|---|---|---|
| A | 4 | 0.4 |
| B | 8 | 0.8 |
| C | 12 | 1.2 |
表2 松土齿耙试验水平
Tab.2 Test level table of soil-loosening tooth harrow
| 试验因素 Test factor | 入土深度 Buried depth (cm) | 前进速度 Forward speed (m/s) |
|---|---|---|
| A | 4 | 0.4 |
| B | 8 | 0.8 |
| C | 12 | 1.2 |
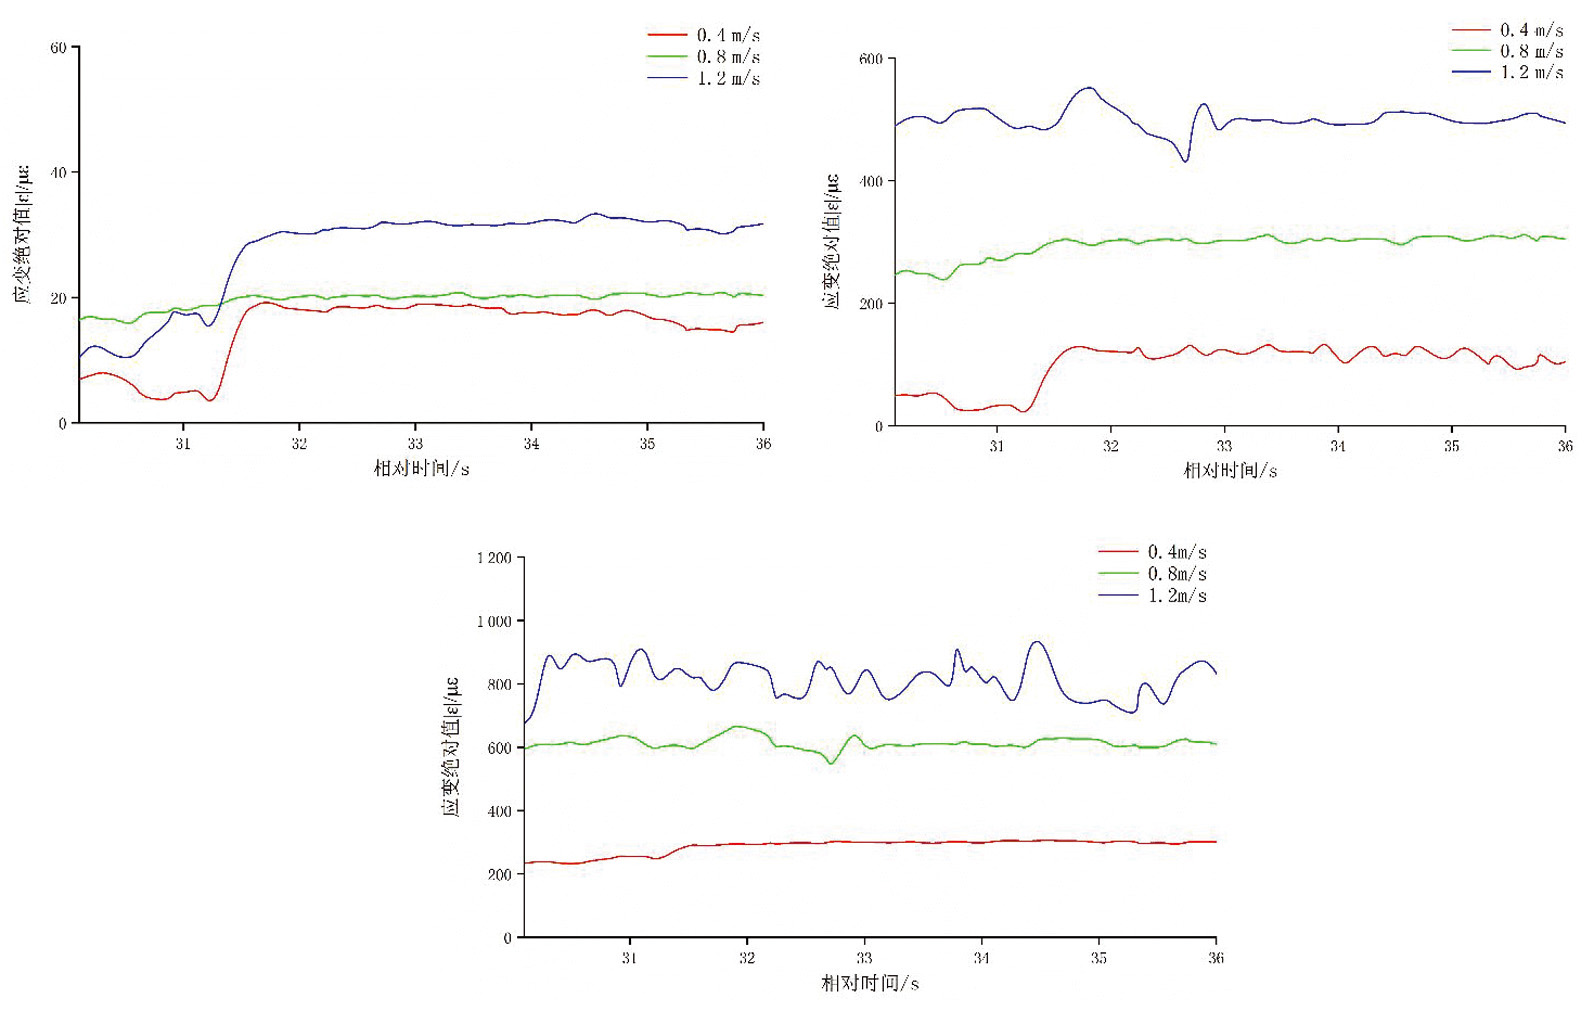
图14 监测点3不同工况应变变化 注:a. 入土深度4 cm的应变变化曲线;b. 入土深度8 cm的应变变化曲线;c. 入土深度12 cm的应变变化曲线
Fig.14 Strain changes at monitoring point 3 under different working conditions Note:a. Strain curve at a depth of 4 cm;b. Strain curve at depth of 8 cm;c. Strain curve at depth of 12 cm
| 预警等级 Warning level | 应力值范围 Stress range |
|---|---|
| 正常Normal | σ<140 Mpa |
| 轻度过载Mild overload | 140≤σ<180 Mpa |
| 严重过载 Severe overload | σ≥180 Mpa |
表3 预警范围
Tab.3 Warning range table
| 预警等级 Warning level | 应力值范围 Stress range |
|---|---|
| 正常Normal | σ<140 Mpa |
| 轻度过载Mild overload | 140≤σ<180 Mpa |
| 严重过载 Severe overload | σ≥180 Mpa |
| 序号 Serial number | 应变 Strain (με) | 输出电压值 Output voltage value (V) |
|---|---|---|
| 1 | 10.95 | 1.131 5 |
| 2 | 114.43 | 1.152 6 |
| 3 | 226.98 | 1.173 0 |
| 4 | 338.91 | 1.194 1 |
| 5 | 453.12 | 1.214 3 |
| 6 | 569.88 | 1.235 4 |
| 7 | 698.21 | 1.256 2 |
| 8 | 799.11 | 1.278 0 |
| 9 | 908.21 | 1.295 1 |
| 10 | 1012.02 | 1.311 0 |
表4 单组试验
Tab.4 Single group test
| 序号 Serial number | 应变 Strain (με) | 输出电压值 Output voltage value (V) |
|---|---|---|
| 1 | 10.95 | 1.131 5 |
| 2 | 114.43 | 1.152 6 |
| 3 | 226.98 | 1.173 0 |
| 4 | 338.91 | 1.194 1 |
| 5 | 453.12 | 1.214 3 |
| 6 | 569.88 | 1.235 4 |
| 7 | 698.21 | 1.256 2 |
| 8 | 799.11 | 1.278 0 |
| 9 | 908.21 | 1.295 1 |
| 10 | 1012.02 | 1.311 0 |
| 应变 Strain (με) | 电压 Output voltage value (V) | ||||||||
|---|---|---|---|---|---|---|---|---|---|
| 12.35 | 11.99 | 9.66 | 12.54 | 9.14 | 1.131 6 | 1.131 6 | 1.131 4 | 1.131 6 | 1.131 3 |
| 113.73 | 114.34 | 115.14 | 114.49 | 114.29 | 1.152 5 | 1.152 6 | 1.152 7 | 1.152 6 | 1.152 6 |
| 226.65 | 226.19 | 225.50 | 227.40 | 226.07 | 1.173 0 | 1.172 9 | 1.172 8 | 1.173 1 | 1.172 9 |
| 339.33 | 340.78 | 340.92 | 339.07 | 340.01 | 1.194 2 | 1.194 3 | 1.194 3 | 1.194 1 | 1.194 2 |
| 453.97 | 454.02 | 453.76 | 453.11 | 452.28 | 1.214 4 | 1.214 5 | 1.214 4 | 1.214 3 | 1.214 2 |
| 571.36 | 571.14 | 571.25 | 569.24 | 568.95 | 1.235 5 | 1.235 4 | 1.235 4 | 1.235 3 | 1.235 2 |
| 697.86 | 697.91 | 698.75 | 700.05 | 698.90 | 1.256 0 | 1.256 0 | 1.256 1 | 1.256 2 | 1.256 1 |
| 799.89 | 800.01 | 798.97 | 800.63 | 798.36 | 1.278 2 | 1.278 2 | 1.278 0 | 1.278 2 | 1.277 9 |
| 907.46 | 908.23 | 908.74 | 908.11 | 909.49 | 1.295 0 | 1.295 1 | 1.295 2 | 1.295 1 | 1.295 3 |
| 1 012.32 | 1 013.13 | 1 012.26 | 1 013.00 | 1 011.98 | 1.311 0 | 1.311 1 | 1.311 0 | 1.311 1 | 1.311 0 |
表5 多组试验
Tab.5 Multi-group tests
| 应变 Strain (με) | 电压 Output voltage value (V) | ||||||||
|---|---|---|---|---|---|---|---|---|---|
| 12.35 | 11.99 | 9.66 | 12.54 | 9.14 | 1.131 6 | 1.131 6 | 1.131 4 | 1.131 6 | 1.131 3 |
| 113.73 | 114.34 | 115.14 | 114.49 | 114.29 | 1.152 5 | 1.152 6 | 1.152 7 | 1.152 6 | 1.152 6 |
| 226.65 | 226.19 | 225.50 | 227.40 | 226.07 | 1.173 0 | 1.172 9 | 1.172 8 | 1.173 1 | 1.172 9 |
| 339.33 | 340.78 | 340.92 | 339.07 | 340.01 | 1.194 2 | 1.194 3 | 1.194 3 | 1.194 1 | 1.194 2 |
| 453.97 | 454.02 | 453.76 | 453.11 | 452.28 | 1.214 4 | 1.214 5 | 1.214 4 | 1.214 3 | 1.214 2 |
| 571.36 | 571.14 | 571.25 | 569.24 | 568.95 | 1.235 5 | 1.235 4 | 1.235 4 | 1.235 3 | 1.235 2 |
| 697.86 | 697.91 | 698.75 | 700.05 | 698.90 | 1.256 0 | 1.256 0 | 1.256 1 | 1.256 2 | 1.256 1 |
| 799.89 | 800.01 | 798.97 | 800.63 | 798.36 | 1.278 2 | 1.278 2 | 1.278 0 | 1.278 2 | 1.277 9 |
| 907.46 | 908.23 | 908.74 | 908.11 | 909.49 | 1.295 0 | 1.295 1 | 1.295 2 | 1.295 1 | 1.295 3 |
| 1 012.32 | 1 013.13 | 1 012.26 | 1 013.00 | 1 011.98 | 1.311 0 | 1.311 1 | 1.311 0 | 1.311 1 | 1.311 0 |
| 序号 Serial number | 监测点1 Monitoring point 1 | 监测点2 Monitoring point 2 | 监测点3 Monitoring point 3 | |||||||||
|---|---|---|---|---|---|---|---|---|---|---|---|---|
| με11 | με21 | |Δμε| | δ1(%) | με12 | με22 | |Δμε| | δ2(%) | με13 | με23 | |Δμε| | δ3(%) | |
| 1 | -1.23 | -1.43 | 0.20 | 16.75 | 0.66 | 0.61 | 0.06 | 7.70 | 0.82 | 0.76 | 0.06 | 7.70 |
| 2 | 6.79 | 7.67 | 0.88 | 12.92 | -3.41 | -3.74 | 0.34 | 9.94 | -5.16 | -6.06 | 0.90 | 17.51 |
| 3 | 12.48 | 12.82 | 0.34 | 2.71 | -6.41 | -6.02 | 1.21 | 18.81 | -32.05 | -33.49 | 1.43 | 4.47 |
| …… | …… | …… | …… | …… | …… | …… | …… | …… | …… | …… | …… | …… |
| 100 | 15.16 | 14.99 | 0.17 | 1.12 | -17.18 | -19.15 | 1.98 | 11.51 | 32.42 | 30.52 | 1.90 | 5.85 |
表6 0.4 m/s前进速度应变测试
Tab.6 Strain test of 0.4 m/s forward velocity
| 序号 Serial number | 监测点1 Monitoring point 1 | 监测点2 Monitoring point 2 | 监测点3 Monitoring point 3 | |||||||||
|---|---|---|---|---|---|---|---|---|---|---|---|---|
| με11 | με21 | |Δμε| | δ1(%) | με12 | με22 | |Δμε| | δ2(%) | με13 | με23 | |Δμε| | δ3(%) | |
| 1 | -1.23 | -1.43 | 0.20 | 16.75 | 0.66 | 0.61 | 0.06 | 7.70 | 0.82 | 0.76 | 0.06 | 7.70 |
| 2 | 6.79 | 7.67 | 0.88 | 12.92 | -3.41 | -3.74 | 0.34 | 9.94 | -5.16 | -6.06 | 0.90 | 17.51 |
| 3 | 12.48 | 12.82 | 0.34 | 2.71 | -6.41 | -6.02 | 1.21 | 18.81 | -32.05 | -33.49 | 1.43 | 4.47 |
| …… | …… | …… | …… | …… | …… | …… | …… | …… | …… | …… | …… | …… |
| 100 | 15.16 | 14.99 | 0.17 | 1.12 | -17.18 | -19.15 | 1.98 | 11.51 | 32.42 | 30.52 | 1.90 | 5.85 |
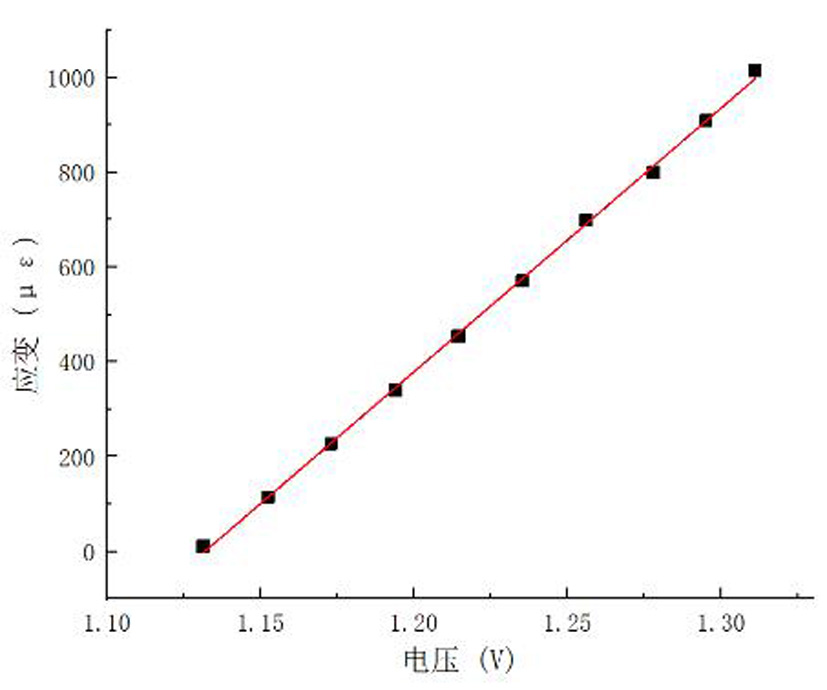
图15 应变-电压回归曲线
Fig.15 Strain-voltage regression curve
| 序号 Serial number | 监测点1 Monitoring point 1 | 监测点2 Monitoring point 2 | 监测点3 Monitoring point 3 | |||||||||
|---|---|---|---|---|---|---|---|---|---|---|---|---|
| με11 | με21 | |Δμε| | δ1(%) | με12 | με22 | |Δμε| | δ2(%) | με13 | με23 | |Δμε| | δ3(%) | |
| 1 | 67.76 | 55.42 | 12.34 | 18.21 | 68.95 | 73.16 | 4.21 | 6.11 | 89.35 | 106.94 | 17.60 | 19.70 |
| 2 | 63.37 | 67.56 | 4.19 | 6.61 | 64.17 | 63.13 | 1.03 | 1.61 | 80.43 | 94.97 | 14.54 | 18.07 |
| 3 | 64.45 | 73.84 | 9.39 | 14.57 | 52.02 | 64.72 | 12.69 | 24.40 | 69.67 | 70.62 | 0.95 | 1.36 |
| …… | …… | …… | …… | …… | …… | …… | …… | …… | …… | …… | …… | …… |
| 100 | -49.37 | -59.46 | 10.09 | 20.41 | -98.61 | -86.59 | 12.02 | 12.19 | 29.13 | 27.86 | 1.27 | 4.36 |
表7 0.8 m/s前进速度应变测试
Tab.7 Strain test results of 0.8 m/s forward velocity
| 序号 Serial number | 监测点1 Monitoring point 1 | 监测点2 Monitoring point 2 | 监测点3 Monitoring point 3 | |||||||||
|---|---|---|---|---|---|---|---|---|---|---|---|---|
| με11 | με21 | |Δμε| | δ1(%) | με12 | με22 | |Δμε| | δ2(%) | με13 | με23 | |Δμε| | δ3(%) | |
| 1 | 67.76 | 55.42 | 12.34 | 18.21 | 68.95 | 73.16 | 4.21 | 6.11 | 89.35 | 106.94 | 17.60 | 19.70 |
| 2 | 63.37 | 67.56 | 4.19 | 6.61 | 64.17 | 63.13 | 1.03 | 1.61 | 80.43 | 94.97 | 14.54 | 18.07 |
| 3 | 64.45 | 73.84 | 9.39 | 14.57 | 52.02 | 64.72 | 12.69 | 24.40 | 69.67 | 70.62 | 0.95 | 1.36 |
| …… | …… | …… | …… | …… | …… | …… | …… | …… | …… | …… | …… | …… |
| 100 | -49.37 | -59.46 | 10.09 | 20.41 | -98.61 | -86.59 | 12.02 | 12.19 | 29.13 | 27.86 | 1.27 | 4.36 |
| 序号 Serial number | 监测点1 Monitoring point 1 | 监测点2 Monitoring point 2 | 监测点3 Monitoring point 3 | |||||||||
|---|---|---|---|---|---|---|---|---|---|---|---|---|
| με11 | με21 | |Δμε| | δ1(%) | με12 | με22 | |Δμε| | δ2(%) | με13 | με23 | |Δμε| | δ3(%) | |
| 1 | 129.21 | 123.91 | 5.30 | 4.10 | 233.07 | 190.38 | 42.69 | 22.41 | -165.56 | -185.27 | 19.71 | 11.90 |
| 2 | 403.88 | 350.19 | 53.69 | 13.29 | 373.45 | 352.71 | 20.74 | 5.88 | -166.85 | -159.74 | 7.11 | 4.26 |
| 3 | -49.88 | -58.47 | 8.59 | 17.23 | 212.46 | 253.47 | 41.01 | 16.18 | -167.29 | -183.50 | 16.21 | 9.69 |
| …… | …… | …… | …… | …… | …… | …… | …… | …… | …… | …… | …… | …… |
| 100 | -346.1 | --370.0 | 23.91 | 6.91 | -112.43 | -102.19 | 10.24 | 10.02 | -366.30 | -293.57 | -72.73 | 19.86 |
表8 1.2 m/s前进速度应变测试
Tab.8 Strain test results of 1.2 m/s forward velocity
| 序号 Serial number | 监测点1 Monitoring point 1 | 监测点2 Monitoring point 2 | 监测点3 Monitoring point 3 | |||||||||
|---|---|---|---|---|---|---|---|---|---|---|---|---|
| με11 | με21 | |Δμε| | δ1(%) | με12 | με22 | |Δμε| | δ2(%) | με13 | με23 | |Δμε| | δ3(%) | |
| 1 | 129.21 | 123.91 | 5.30 | 4.10 | 233.07 | 190.38 | 42.69 | 22.41 | -165.56 | -185.27 | 19.71 | 11.90 |
| 2 | 403.88 | 350.19 | 53.69 | 13.29 | 373.45 | 352.71 | 20.74 | 5.88 | -166.85 | -159.74 | 7.11 | 4.26 |
| 3 | -49.88 | -58.47 | 8.59 | 17.23 | 212.46 | 253.47 | 41.01 | 16.18 | -167.29 | -183.50 | 16.21 | 9.69 |
| …… | …… | …… | …… | …… | …… | …… | …… | …… | …… | …… | …… | …… |
| 100 | -346.1 | --370.0 | 23.91 | 6.91 | -112.43 | -102.19 | 10.24 | 10.02 | -366.30 | -293.57 | -72.73 | 19.86 |
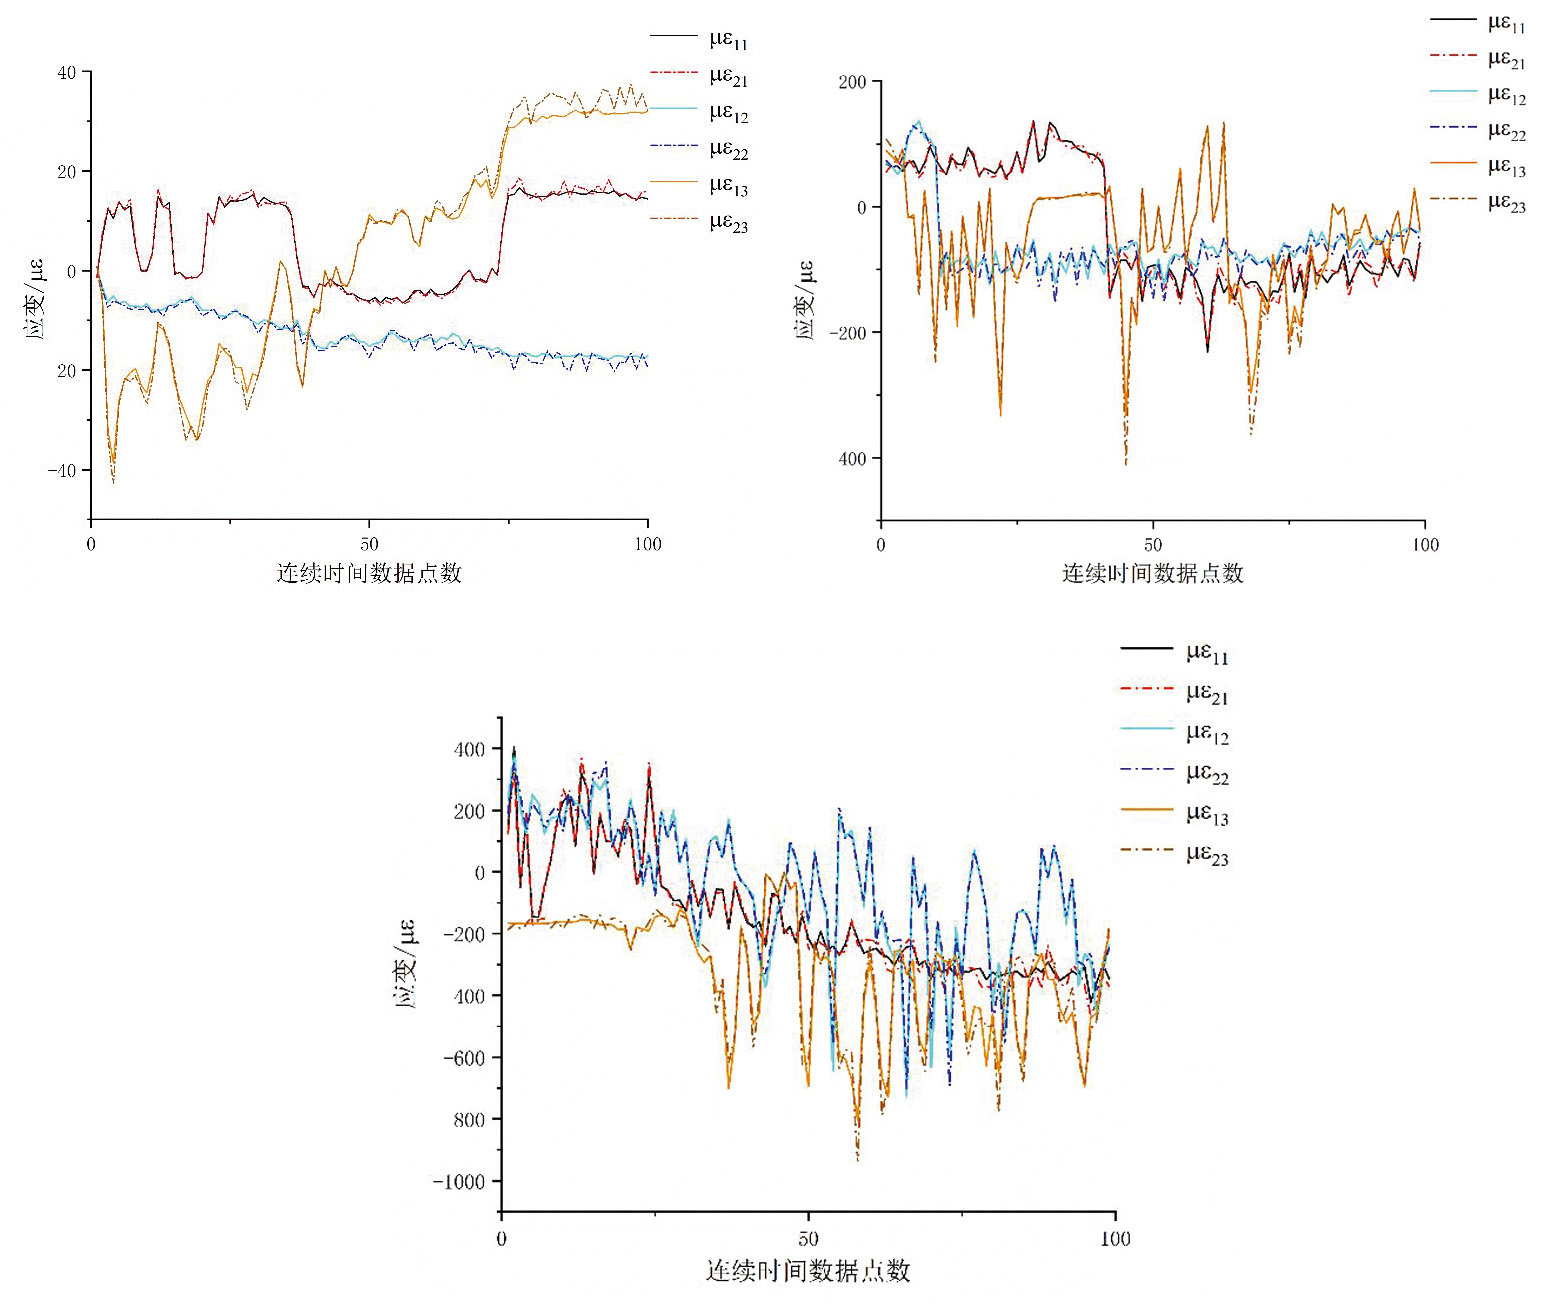
图16 结果对比 注:a. 0.4 m/s前进速度应变测试结果对比;b. 0.8 m/s前进速度应变测试结果对比;c 1.2 m/s前进速度应变测试结果对比
Fig.16 Comparison of results Note:a. Comparison of strain test results of 0.4 m/s forward velocity;b.Comparison of strain test results of 0.8 m/s forward velocity;c. Comparison of strain test results of 1.2 m/s forward velocity
| [1] | 牛长河, 王学农, 刘旋峰, 等. 基于有限元分析法的棉田残膜回收机松土齿结构改进[J]. 农机化研究, 2016, 38(3): 33-36. |
| NIU Changhe, WANG Xuenong, LIU Xuanfeng, et al. The ripper tooth structural improvements of cotton fields plastic film recycling machine based on the finite element method[J]. Journal of Agricultural Mechanization Research, 2016, 38(3): 33-36. | |
| [2] | 尹福炎. 电阻应变片发展历史的回顾——纪念电阻应变片诞生70周年(1938—2008)[J]. 衡器, 2009, 38(4): 46-52. |
| YIN Fuyan. The review Of electronic resistance strain gage development history—commemorate electronic resistance strain gage has been for 70 years[J]. Weighing Instrument, 2009, 38(4): 46-52. | |
| [3] | Allmen L V, Bailleul G, Becker T, et al. Aircraft strain WSN powered by heat storage harvesting[J]. IEEE Transactions on Industrial Electronics, 2017, 64(9): 7284-7292. |
| [4] | 周祖德, 谭跃刚, 刘明尧, 等. 机械系统光纤光栅分布动态监测与诊断的现状与发展[J]. 机械工程学报, 2013, 49(19): 55-69. |
| ZHOU Zude, TAN Yuegang, LIU Mingyao, et al. Actualities and development on dynamic monitoring and diagnosis with distributed fiber Bragg grating in mechanical systems[J]. Journal of Mechanical Engineering, 2013, 49(19): 55-69. | |
| [5] | 冯昆鹏. 基于四芯锥形相移光纤光栅的三维微尺度传感方法[D]. 哈尔滨: 哈尔滨工业大学, 2018. |
| FENG Kunpeng. Three-dimensional Microscale Sensing Method Bsaed on Tapered Fourcores Phase-shift Fiber Grating[D]. Harbin: Harbin Institute of Technology, 2018. | |
| [6] |
房芳, 郑辉, 汪玉, 等. 机械结构健康监测综述[J]. 机械工程学报, 2021, 57(16): 269-292.
DOI |
|
FANG Fang, ZHENG Hui, WANG Yu, et al. Mechanical structural health monitoring: a review[J]. Journal of Mechanical Engineering, 2021, 57(16): 269-292.
DOI |
|
| [7] | 邢作霞, 薛田威, 张军阳. 一种叶根机械载荷测试方法的研究[J]. 可再生能源, 2013, 31(3): 73-76. |
| XING Zuoxia, XUE Tianwei, ZHANG Junyang. Study on testing method of mechanical load of blade root[J]. Renewable Energy Resources, 2013, 31(3): 73-76. | |
| [8] | 尚奎星. 自供能式矿井提升系统状态监测传感器网络设计[D]. 徐州: 中国矿业大学, 2020. |
| SHANG Kuixing. Design of Self-Powered Sensor Networks for Condition Monitoring of Mine Hoisting System[D]. Xuzhou: China University of Mining and Technology, 2020. | |
| [9] | 李长才, 肖金球, 华猛. 基于ADS1115多通道低功耗环境参数检测系统设计[J]. 苏州科技大学学报(工程技术版), 2017, 30(3): 77-80. |
| LI Changcai, XIAO Jinqiu, HUA Meng. Design of multichannel low-power environment parameters test system based on ADS1115[J]. Journal of Suzhou University of Science and Technology Engineering and Technology Edition, 2017, 30(3): 77-80. | |
| [10] | 王芳琴. 单片机控制的节水灌溉系统的研究[D]. 武汉: 华中农业大学, 2005. |
| WANG Fangqin. Research on Water-saving Irrigation System Controled by MCU[D]. Wuhan: Huazhong Agricultural University, 2005. | |
| [11] | 刘天泉. 嵌入式系统软件设计方法研究及应用[D]. 杭州: 浙江大学, 2004. |
| LIU Tianquan. The Study and Application of Embedded Software Design[D]. Hangzhou: Zhejiang University, 2004. | |
| [12] | 丁力, 宋志平, 徐萌萌, 等. 基于STM32的嵌入式测控系统设计[J]. 中南大学学报(自然科学版), 2013, 44(S1): 260-265. |
| DING Li, SONG Zhiping, XU Mengmeng, et al. Design of embedded measurement and control system based on STM32[J]. Journal of Central South University (Science and Technology), 2013, 44(S1): 260-265. | |
| [13] | 何昌俊. 基于连续分流的小型类球状水果自动定量称重系统研究[D]. 杭州: 浙江农林大学, 2020. |
| HE Changjun. Research on Automatic Quantitative Weighing System of small spheroid Fruits Based on Continuous flow[D]. Hangzhou: Zhejiang A&F University, 2020. | |
| [14] | 鲍小雨. 基于多源数据融合的室内高精度位置估计技术研究[D]. 南京: 东南大学, 2019. |
| BAO Xiaoyu. Research on indoor high-precision location estimation Technology based on Multi-source data Fusion[D]. Nanjing: Southeast University, 2019. | |
| [15] | 张佳喜, 杨程, 张丽, 等. 玉米起茬机构的强度及振动特性分析与试验[J]. 农业工程学报, 2018, 34(12): 72-78. |
| ZHANG Jiaxi, YANG Cheng, ZHANG Li, et al. Analysis and experiment on strength and vibration characteristics of corn stubble plucking mechanism[J]. Transactions of the Chinese Society of Agricultural Engineering, 2018, 34(12): 72-78. | |
| [16] | 汪凤珠, 张俊宁, 李瑞川, 等. 花生联合收获机作业在线监测与故障预警系统研究[J]. 农业机械学报, 2015, 46(S1): 69-73. |
| WANG Fengzhu, ZHANG Junning, LI Ruichuan, et al. Study on on-line monitoring and fault early warning system of peanut combine harvester[J]. Transactions of the Chinese Society for Agricultural Machinery, 2015, 46(S1): 69-73. | |
| [17] | 卢腊. 联合收割机田间作业状态在线监测系统研究[D]. 重庆: 重庆理工大学, 2018. |
| LU La. Research on Online Monitoring System for Combine Harvester Working Status[D]. Chongqing: Chongqing University of Technology, 2018. | |
| [18] | 赵继政, 庄蒲宁, 石富磊, 等. 基于物联网技术的奶牛瘤胃pH值和温度监测系统研究[J]. 农业机械学报, 2022, 53(2): 291-298, 308. |
| ZHAO Jizheng, ZHUANG Puning, SHI Fulei, et al. Design and experiment of rumen pH value and temperature monitoring system for dairy cows based on Internet of things[J]. Transactions of the Chinese Society for Agricultural Machinery, 2022, 53(2): 291-298, 308. | |
| [19] | 吴蕊. 基于ZigBee的无线桥梁应力传感器的研究与设计[D]. 西安: 西安科技大学, 2011. |
| WU Rui. Research and Design of Wireless Stress Sensor Based on ZigBee for Bridge[D]. Xi’an: Xi’an University of Science and Technology, 2011. | |
| [20] | 冷建成, 钱万东, 周临风. 基于应力监测的油气管道安全预警试验研究[J]. 石油机械, 2021, 49(6): 139-144. |
| LENG Jiancheng, QIAN Wandong, ZHOU Linfeng. Experimental study on safety warning of oil and gas pipeline based on stress monitoring[J]. China Petroleum Machinery, 2021, 49(6): 139-144. | |
| [21] | Ozbek M, Rixen D J. Operational modal analysis of a 2.5 MW wind turbine using optical measurement techniques and strain gauges[J]. Wind Energy, 2013, 16(3): 367-381. |
| [22] | 杨军凯, 陈彦, 王护利. 基于直角应变花的输油管道应力监测系统[J]. 兵工自动化, 2015, 34(3): 74-76. |
| YANG Junkai, CHEN Yan, WANG Huli. Stress detection system for oil pipeline based on rectangular rosette[J]. Ordnance Industry Automation, 2015, 34(3): 74-76. |
| [1] | 董志强, 冯小康, 慈宝霞, 文帅, 王钊, 刘扬, 马富裕. 棉田土壤养分分析与土壤墒情监测系统应用[J]. 新疆农业科学, 2021, 58(10): 1900-1908. |
| 阅读次数 | ||||||||||||||||||||||||||||||||||||||||||||||||||
|
全文 21
|
|
|||||||||||||||||||||||||||||||||||||||||||||||||
|
摘要 131
|
|
|||||||||||||||||||||||||||||||||||||||||||||||||