
新疆农业科学 ›› 2021, Vol. 58 ›› Issue (11): 2011-2023.DOI: 10.6048/j.issn.1001-4330.2021.11.006
张梦婕1( ), 吴湘琳1, 魏亚媛2, 耿庆龙2, 哈丽哈什·依巴提1, 李青军1()
收稿日期:2020-10-28
出版日期:2021-11-20
发布日期:2021-12-16
通信作者:
李青军
作者简介:张梦婕(1991-),女,新疆阿克苏人,研究实习员,研究方向为土壤肥料,(E-mail) 575261802@qq.com
基金资助:
ZHANG Mengjie1(), WU Xianglin1, WEI Yayuan2, GENG Qinglong2, Halihashiebati Yibati1, LI Qingjun1()
Received:2020-10-28
Online:2021-11-20
Published:2021-12-16
Correspondence author:
LI Qingjun
Supported by:摘要:
【目的】研究棉花幼苗在混合盐碱胁迫下渗透调节物质耐盐响应机制。【方法】以新陆早57号为研究对象,将NaCl、Na2SO4、NaHCO3和Na2CO3 4种盐按不同比例混合进行人工模拟混合盐胁迫条件,以碱性盐比例逐步增大的顺序分成A、B、C、D、E 5组不同浓度处理。【结果】棉花幼苗叶片渗透调节物质与盐碱比例、盐碱浓度呈极显著相关(P<0.01),且盐碱比例与盐碱浓度的交互作用对棉花幼苗叶片的渗透调节物质影响呈极显著相关;随着盐碱浓度的增大脯氨酸含量均呈现上升趋势,在200 mmol/L下含量达到最大;在B处理下(NaCl、NaHCO3)随着浓度的增大脯氨酸含量增加的趋势明显大于其他处理,且在150、200 mmol/L下含量差异较小;在C处理下(含有NaCl、Na2SO4、NaHCO3、Na2CO3),在浓度为25 mmol/L下,叶片的脯氨酸含量增加幅度最大,其随着浓度的增加,脯氨酸含量增加幅度明显降低;丙二醛、可溶性糖变化趋势与游离脯氨酸变化趋势相似,而可溶性蛋白含量随着处理浓度的增加而增加,但增加幅度较小;且差异不显著。【结论】棉花幼苗叶片渗透调节物质与盐碱比例、盐碱浓度呈极显著相关(P<0.01),且盐碱比例与盐碱浓度的交互作用对棉花幼苗叶片的渗透调节物质影响呈极显著相关,在同一种混合盐处理下,脯氨酸、可溶性糖、丙二醛的含量、游离脯氨酸含量随着盐浓度的增加而增加;可溶性蛋白含量,随着浓度的增加,增加幅度较小,但在同一盐浓度不同盐碱比例中差异显著,混合盐碱胁迫下棉花幼苗叶片可溶性蛋白含量是评价棉花耐盐性的主要渗透调节物质。
中图分类号:
张梦婕, 吴湘琳, 魏亚媛, 耿庆龙, 哈丽哈什·依巴提, 李青军. 混合盐碱对棉花幼苗渗透调节物质的影响[J]. 新疆农业科学, 2021, 58(11): 2011-2023.
ZHANG Mengjie, WU Xianglin, WEI Yayuan, GENG Qinglong, Halihashiebati Yibati, LI Qingjun. Effects of Mixed Salt and Alkali on Osmoregulation of Cotton Seedlings[J]. Xinjiang Agricultural Sciences, 2021, 58(11): 2011-2023.
| 处理组 | 盐分组成及摩尔比 | 各盐浓度(mmol/L)处理组对应pH | ||||||||
|---|---|---|---|---|---|---|---|---|---|---|
| NaCl | Na2SO4 | NaHCO3 | Na2 CO3 | 25 | 50 | 100 | 150 | 200 | 平均 | |
| CK | 0 | 0 | 0 | 0 | 7.00 | 7.00 | 7.00 | 7.00 | 7.00 | 7.00 |
| A | 1 | 1 | 0 | 0 | 7.12 | 7.16 | 7.24 | 7.35 | 7.46 | |
| B | 1 | 0 | 1 | 0 | 8.26 | 8.32 | 8.39 | 8.48 | 8.58 | |
| C | 1 | 1 | 1 | 1 | 9.24 | 9.31 | 9.45 | 9.52 | 9.59 | |
| D | 0 | 1 | 0 | 1 | 10.11 | 10.18 | 10.26 | 10.37 | 10.46 | |
| E | 0 | 0 | 1 | 1 | 11.03 | 11.12 | 11.19 | 11.27 | 11.33 | |
表1 各处理组的盐分组成、摩尔比以及相应的pH值
Table 1 Salt composition, molar ratio and corresponding pH values of each treatment group
| 处理组 | 盐分组成及摩尔比 | 各盐浓度(mmol/L)处理组对应pH | ||||||||
|---|---|---|---|---|---|---|---|---|---|---|
| NaCl | Na2SO4 | NaHCO3 | Na2 CO3 | 25 | 50 | 100 | 150 | 200 | 平均 | |
| CK | 0 | 0 | 0 | 0 | 7.00 | 7.00 | 7.00 | 7.00 | 7.00 | 7.00 |
| A | 1 | 1 | 0 | 0 | 7.12 | 7.16 | 7.24 | 7.35 | 7.46 | |
| B | 1 | 0 | 1 | 0 | 8.26 | 8.32 | 8.39 | 8.48 | 8.58 | |
| C | 1 | 1 | 1 | 1 | 9.24 | 9.31 | 9.45 | 9.52 | 9.59 | |
| D | 0 | 1 | 0 | 1 | 10.11 | 10.18 | 10.26 | 10.37 | 10.46 | |
| E | 0 | 0 | 1 | 1 | 11.03 | 11.12 | 11.19 | 11.27 | 11.33 | |
| 方差分析 Variance analysis | 变异来源 Source of variation | 平方和 SS | 均方 MEAN | F |
|---|---|---|---|---|
| 脯氨酸含量 Proline content | 盐碱比例SR | 40.900 9 | 10.225 2 | 7.408 9** |
| 盐碱浓度SC | 52.239 1 | 13.059 8 | 9.462 7** | |
| 比例×浓度SR×SC | 93.140 0 | 11.642 5 | 8.435 8** | |
| 丙二醛含量 MAD | 盐碱比例SR | 43.565 3 | 8.713 1 | 5.700 9** |
| 盐碱浓度SC | 14.941 9 | 2.988 4 | 1.955 3 | |
| 比例×浓度SR×SC | 60.526 3 | 6.052 6 | 3.960 2** | |
| 可溶性蛋白含量 Solubleprotein content | 盐碱比例SR | 0.423 0 | 0.084 6 | 7.477 5** |
| 盐碱浓度SC | 0.012 3 | 0.002 5 | 0.216 8 | |
| 比例×浓度SR×SC | 0.438 0 | 0.043 8 | 3.872 0** | |
| 可溶性糖含量 Soluble sugar content | 盐碱比例SR | 0.008 5 | 0.001 7 | 8.670 1** |
| 盐碱浓度SC | 0.008 2 | 0.001 6 | 8.288 6** | |
| 比例×浓度SR×SC | 0.017 6 | 0.001 8 | 8.952 4** |
表2 棉花幼苗叶片渗透调节物质在不同处理下方差
Table 2 Variance analysis of osmoregulation substances in leaves of cotton seedlings under different treatments
| 方差分析 Variance analysis | 变异来源 Source of variation | 平方和 SS | 均方 MEAN | F |
|---|---|---|---|---|
| 脯氨酸含量 Proline content | 盐碱比例SR | 40.900 9 | 10.225 2 | 7.408 9** |
| 盐碱浓度SC | 52.239 1 | 13.059 8 | 9.462 7** | |
| 比例×浓度SR×SC | 93.140 0 | 11.642 5 | 8.435 8** | |
| 丙二醛含量 MAD | 盐碱比例SR | 43.565 3 | 8.713 1 | 5.700 9** |
| 盐碱浓度SC | 14.941 9 | 2.988 4 | 1.955 3 | |
| 比例×浓度SR×SC | 60.526 3 | 6.052 6 | 3.960 2** | |
| 可溶性蛋白含量 Solubleprotein content | 盐碱比例SR | 0.423 0 | 0.084 6 | 7.477 5** |
| 盐碱浓度SC | 0.012 3 | 0.002 5 | 0.216 8 | |
| 比例×浓度SR×SC | 0.438 0 | 0.043 8 | 3.872 0** | |
| 可溶性糖含量 Soluble sugar content | 盐碱比例SR | 0.008 5 | 0.001 7 | 8.670 1** |
| 盐碱浓度SC | 0.008 2 | 0.001 6 | 8.288 6** | |
| 比例×浓度SR×SC | 0.017 6 | 0.001 8 | 8.952 4** |
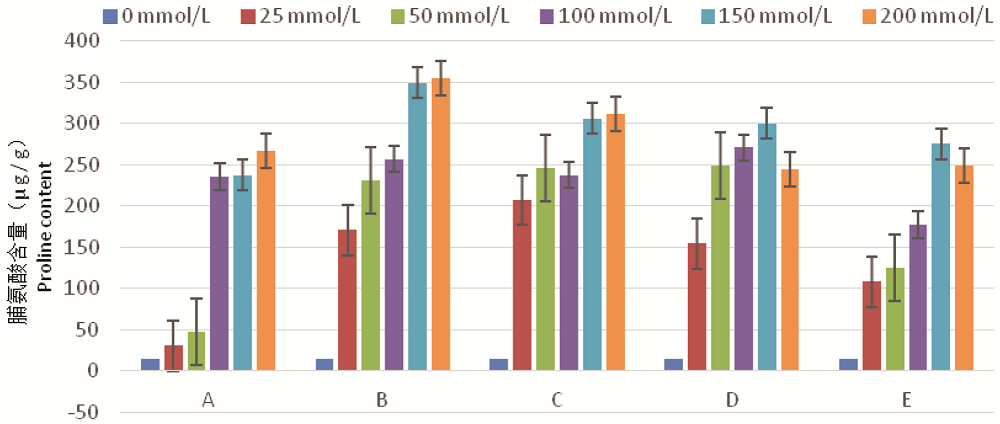
图1 不同处理样品脯氨酸含量
Fig.1 The proline content of different treatments
| 处理 T | MeanDiff | SEM | q Value | Prob | Sig |
|---|---|---|---|---|---|
| A CK | 140.530 | 57.950 | 3.430 | 0.210 | 0 |
| B CK | 266.860 | 57.950 | 6.510 | 0.000 | 1 |
| B A | 126.330 | 33.460 | 5.340 | 0.020 | 1 |
| C CK | 260.980 | 57.950 | 6.370 | 0.000 | 1 |
| C A | 120.450 | 33.460 | 5.090 | 0.030 | 1 |
| C B | -5.870 | 33.460 | 0.250 | 1.000 | 0 |
| D CK | 239.200 | 57.950 | 5.840 | 0.010 | 1 |
| D A | 98.670 | 33.460 | 4.170 | 0.090 | 0 |
| D B | -27.650 | 33.460 | 1.171 | 0.960 | 0 |
| D C | -21.780 | 33.461 | 0.921 | 0.980 | 0 |
| E CK | 148.480 | 57.950 | 3.620 | 0.170 | 0 |
| E A | 7.950 | 33.460 | 0.340 | 1.000 | 0 |
| E B | -118.370 | 33.461 | 5.000 | 0.030 | 1 |
| E C | -112.500 | 33.460 | 4.751 | 0.040 | 1 |
| E D | -90.720 | 33.461 | 3.831 | 0.130 | 0 |
表3 不同盐碱成分处理样品脯氨酸含量方差
Table 3 Analysis of variance of proline content in samples treated with different salt and alkali components
| 处理 T | MeanDiff | SEM | q Value | Prob | Sig |
|---|---|---|---|---|---|
| A CK | 140.530 | 57.950 | 3.430 | 0.210 | 0 |
| B CK | 266.860 | 57.950 | 6.510 | 0.000 | 1 |
| B A | 126.330 | 33.460 | 5.340 | 0.020 | 1 |
| C CK | 260.980 | 57.950 | 6.370 | 0.000 | 1 |
| C A | 120.450 | 33.460 | 5.090 | 0.030 | 1 |
| C B | -5.870 | 33.460 | 0.250 | 1.000 | 0 |
| D CK | 239.200 | 57.950 | 5.840 | 0.010 | 1 |
| D A | 98.670 | 33.460 | 4.170 | 0.090 | 0 |
| D B | -27.650 | 33.460 | 1.171 | 0.960 | 0 |
| D C | -21.780 | 33.461 | 0.921 | 0.980 | 0 |
| E CK | 148.480 | 57.950 | 3.620 | 0.170 | 0 |
| E A | 7.950 | 33.460 | 0.340 | 1.000 | 0 |
| E B | -118.370 | 33.461 | 5.000 | 0.030 | 1 |
| E C | -112.500 | 33.460 | 4.751 | 0.040 | 1 |
| E D | -90.720 | 33.461 | 3.831 | 0.130 | 0 |
| 处理T | MeanDiff | SEM | q Value | Prob | Sig |
|---|---|---|---|---|---|
| 25 0 | 126.52 | 57.951 | 3.090 | 0.300 | 0 |
| 50 0 | 159.47 | 57.954 | 3.891 | 0.120 | 0 |
| 50 25 | 32.950 | 33.462 | 1.391 | 0.920 | 0 |
| 100 0 | 217.800 | 57.957 | 5.311 | 0.020 | 1 |
| 100 25 | 91.290 | 33.464 | 3.860 | 0.130 | 0 |
| 100 50 | 58.330 | 33.465 | 2.470 | 0.530 | 0 |
| 150 0 | 280.490 | 57.951 | 6.840 | 0.000 | 1 |
| 150 25 | 153.980 | 33.464 | 6.510 | 0.00 | 1 |
| 150 50 | 121.020 | 33.461 | 5.120 | 0.030 | 1 |
| 150 100 | 62.690 | 33.460 | 2.650 | 0.450 | 0 |
| 200 0 | 271.780 | 57.951 | 6.630 | 0.000 | 1 |
| 200 25 | 145.270 | 33.460 | 6.140 | 0.010 | 1 |
| 200 50 | 112.310 | 33.460 | 4.750 | 0.040 | 1 |
| 200 100 | 53.980 | 33.460 | 2.280 | 0.600 | 0 |
| 200 150 | -8.710 | 33.460 | 0.370 | 1.000 | 0 |
表4 不同盐碱浓度处理样品脯氨酸方差
Table 4 Analysis of variance of proline in samples treated with different salt and alkali concentrations
| 处理T | MeanDiff | SEM | q Value | Prob | Sig |
|---|---|---|---|---|---|
| 25 0 | 126.52 | 57.951 | 3.090 | 0.300 | 0 |
| 50 0 | 159.47 | 57.954 | 3.891 | 0.120 | 0 |
| 50 25 | 32.950 | 33.462 | 1.391 | 0.920 | 0 |
| 100 0 | 217.800 | 57.957 | 5.311 | 0.020 | 1 |
| 100 25 | 91.290 | 33.464 | 3.860 | 0.130 | 0 |
| 100 50 | 58.330 | 33.465 | 2.470 | 0.530 | 0 |
| 150 0 | 280.490 | 57.951 | 6.840 | 0.000 | 1 |
| 150 25 | 153.980 | 33.464 | 6.510 | 0.00 | 1 |
| 150 50 | 121.020 | 33.461 | 5.120 | 0.030 | 1 |
| 150 100 | 62.690 | 33.460 | 2.650 | 0.450 | 0 |
| 200 0 | 271.780 | 57.951 | 6.630 | 0.000 | 1 |
| 200 25 | 145.270 | 33.460 | 6.140 | 0.010 | 1 |
| 200 50 | 112.310 | 33.460 | 4.750 | 0.040 | 1 |
| 200 100 | 53.980 | 33.460 | 2.280 | 0.600 | 0 |
| 200 150 | -8.710 | 33.460 | 0.370 | 1.000 | 0 |
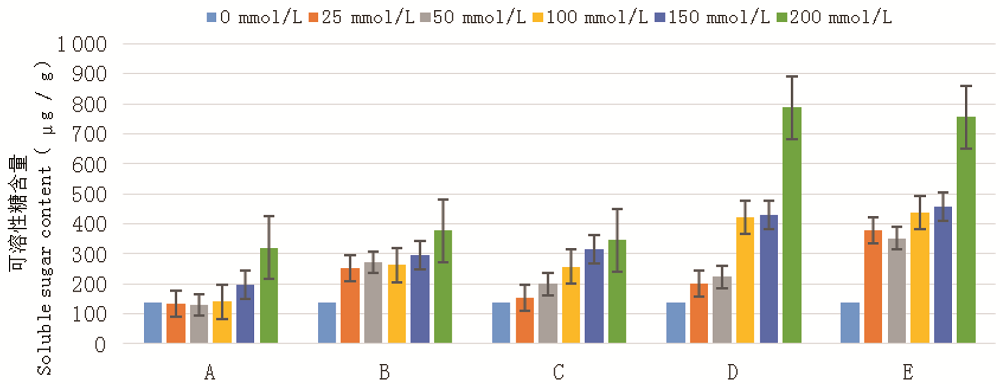
图2 不同处理样品可溶性糖含量
Fig.2 The soluble sugar content of different samples
| 处理T | MeanDiff | SEM | q Value | Prob | Alpha | Sig |
|---|---|---|---|---|---|---|
| A CK | 40.178 | 80.069 | 0.710 | 0.995 33 | 0.05 | 0 |
| B CK | 153.766 | 80.069 | 2.716 | 0.427 65 | 0.05 | 0 |
| B A | 113.588 | 46.228 | 3.475 | 0.198 26 | 0.05 | 0 |
| C CK | 107.648 | 78.949 | 1.928 | 0.746 8 | 0.05 | 0 |
| C A | 67.470 | 44.260 | 2.156 | 0.655 19 | 0.05 | 0 |
| C B | -46.118 | 44.260 | 1.474 | 0.896 21 | 0.05 | 0 |
| D CK | 299.532 | 80.069 | 5.290 | 0.019 81 | 0.05 | 1 |
| D A | 259.354 | 46.228 | 7.934 | 5.82E-04 | 0.05 | 1 |
| D B | 145.766 | 46.228 | 4.459 | 0.059 63 | 0.05 | 0 |
| D C | 191.884 | 44.260 | 6.131 | 0.006 35 | 0.05 | 1 |
| E CK | 389.048 | 81.720 | 6.733 | 0.002 82 | 0.05 | 1 |
| E A | 348.870 | 49.032 | 10.062 | 4.34E-05 | 0.05 | 1 |
| E B | 235.282 | 49.032 | 6.786 | 0.002 63 | 0.05 | 1 |
| E C | 281.399 | 47.181 | 8.435 | 3.09E-04 | 0.05 | 1 |
| E D | 89.516 | 49.032 | 2.582 | 0.479 59 | 0.05 | 0 |
表5 不同盐碱成分处理样品可溶性糖方差
Table 5 Analysis of variance of soluble sugar of samples treated with different salt and alkali components
| 处理T | MeanDiff | SEM | q Value | Prob | Alpha | Sig |
|---|---|---|---|---|---|---|
| A CK | 40.178 | 80.069 | 0.710 | 0.995 33 | 0.05 | 0 |
| B CK | 153.766 | 80.069 | 2.716 | 0.427 65 | 0.05 | 0 |
| B A | 113.588 | 46.228 | 3.475 | 0.198 26 | 0.05 | 0 |
| C CK | 107.648 | 78.949 | 1.928 | 0.746 8 | 0.05 | 0 |
| C A | 67.470 | 44.260 | 2.156 | 0.655 19 | 0.05 | 0 |
| C B | -46.118 | 44.260 | 1.474 | 0.896 21 | 0.05 | 0 |
| D CK | 299.532 | 80.069 | 5.290 | 0.019 81 | 0.05 | 1 |
| D A | 259.354 | 46.228 | 7.934 | 5.82E-04 | 0.05 | 1 |
| D B | 145.766 | 46.228 | 4.459 | 0.059 63 | 0.05 | 0 |
| D C | 191.884 | 44.260 | 6.131 | 0.006 35 | 0.05 | 1 |
| E CK | 389.048 | 81.720 | 6.733 | 0.002 82 | 0.05 | 1 |
| E A | 348.870 | 49.032 | 10.062 | 4.34E-05 | 0.05 | 1 |
| E B | 235.282 | 49.032 | 6.786 | 0.002 63 | 0.05 | 1 |
| E C | 281.399 | 47.181 | 8.435 | 3.09E-04 | 0.05 | 1 |
| E D | 89.516 | 49.032 | 2.582 | 0.479 59 | 0.05 | 0 |
| 处理T | MeanDiff | SEM | q Value | Prob | Alpha | Sig |
|---|---|---|---|---|---|---|
| 25 0 | 76.766 | 80.069 | 1.356 | 0.924 | 0.05 | 0 |
| 50 0 | 106.002 | 80.069 | 1.872 | 0.768 16 | 0.05 | 0 |
| 50 25 | 29.236 | 46.228 | 0.894 | 0.986 61 | 0.05 | 0 |
| 100 0 | 172.120 | 80.069 | 3.040 | 0.315 05 | 0.05 | 0 |
| 100 25 | 95.354 | 46.228 | 2.917 | 0.355 35 | 0.05 | 0 |
| 100 50 | 66.118 | 46.228 | 2.023 | 0.709 59 | 0.05 | 0 |
| 150 0 | 192.474 | 80.069 | 3.400 | 0.215 64 | 0.05 | 0 |
| 150 25 | 115.708 | 46.228 | 3.540 | 0.184 22 | 0.05 | 0 |
| 150 50 | 86.472 | 46.228 | 2.645 | 0.454 65 | 0.05 | 0 |
| 150 100 | 20.354 | 46.228 | 0.623 | 0.997 47 | 0.05 | 0 |
| 200 0 | 386.530 | 80.069 | 6.827 | 0.002 49 | 0.05 | 1 |
| 200 25 | 309.764 | 46.228 | 9.476 | 8.63E-05 | 0.05 | 1 |
| 200 50 | 280.528 | 46.228 | 8.582 | 2.57E-04 | 0.05 | 1 |
| 200 100 | 214.410 | 46.228 | 6.559 | 0.003 56 | 0.05 | 1 |
| 200 150 | 194.056 | 46.228 | 5.937 | 0.008 26 | 0.05 | 1 |
表6 不同盐碱浓度处理样品可溶性糖含量方差
Table 6 Analysis of variance of soluble sugar content of samples treated with different salt and alkali concentrations
| 处理T | MeanDiff | SEM | q Value | Prob | Alpha | Sig |
|---|---|---|---|---|---|---|
| 25 0 | 76.766 | 80.069 | 1.356 | 0.924 | 0.05 | 0 |
| 50 0 | 106.002 | 80.069 | 1.872 | 0.768 16 | 0.05 | 0 |
| 50 25 | 29.236 | 46.228 | 0.894 | 0.986 61 | 0.05 | 0 |
| 100 0 | 172.120 | 80.069 | 3.040 | 0.315 05 | 0.05 | 0 |
| 100 25 | 95.354 | 46.228 | 2.917 | 0.355 35 | 0.05 | 0 |
| 100 50 | 66.118 | 46.228 | 2.023 | 0.709 59 | 0.05 | 0 |
| 150 0 | 192.474 | 80.069 | 3.400 | 0.215 64 | 0.05 | 0 |
| 150 25 | 115.708 | 46.228 | 3.540 | 0.184 22 | 0.05 | 0 |
| 150 50 | 86.472 | 46.228 | 2.645 | 0.454 65 | 0.05 | 0 |
| 150 100 | 20.354 | 46.228 | 0.623 | 0.997 47 | 0.05 | 0 |
| 200 0 | 386.530 | 80.069 | 6.827 | 0.002 49 | 0.05 | 1 |
| 200 25 | 309.764 | 46.228 | 9.476 | 8.63E-05 | 0.05 | 1 |
| 200 50 | 280.528 | 46.228 | 8.582 | 2.57E-04 | 0.05 | 1 |
| 200 100 | 214.410 | 46.228 | 6.559 | 0.003 56 | 0.05 | 1 |
| 200 150 | 194.056 | 46.228 | 5.937 | 0.008 26 | 0.05 | 1 |
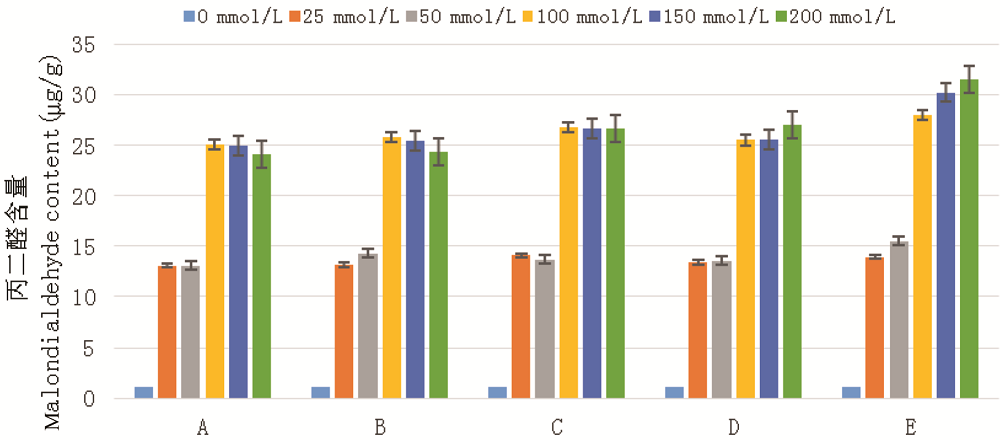
图3 不同处理样品丙二醛含量
Fig.3 The content of malondialdehyde in different samples
| 处理T | MeanDiff | SEM | q Value | Prob | Sig |
|---|---|---|---|---|---|
| A CK | 18.844 | 1.504 7 | 17.710 76 | 2.97E-08 | 1 |
| B CK | 19.170 | 1.504 7 | 18.017 15 | 2.59E-08 | 1 |
| B A | 0.326 | 0.868 74 | 0.530 69 | 0.998 82 | 0 |
| C CK | 18.858 | 1.483 66 | 17.975 65 | 2.64E-08 | 1 |
| C A | 0.014 33 | 0.831 76 | 0.024 37 | 1 | 0 |
| C B | -0.311 67 | 0.831 76 | 0.529 92 | 0.998 82 | 0 |
| D CK | 21.517 5 | 1.535 73 | 19.814 88 | 1.79E-08 | 1 |
| D A | 2.673 5 | 0.921 44 | 4.103 26 | 0.093 78 | 0 |
| D B | 2.347 5 | 0.921 44 | 3.602 92 | 0.171 35 | 0 |
| D C | 2.659 17 | 0.886 65 | 4.241 37 | 0.078 83 | 0 |
| E CK | 22.77 | 1.504 7 | 21.400 66 | 9.50E-08 | 1 |
| E A | 3.926 | 0.868 74 | 6.391 09 | 0.004 47 | 1 |
| E B | 3.6 | 0.868 74 | 5.860 4 | 0.009 16 | 1 |
| E C | 3.911 67 | 0.831 76 | 6.650 91 | 0.003 15 | 1 |
| E D | 1.252 5 | 0.921 44 | 1.922 32 | 0.749 11 | 0 |
表7 不同盐碱成分处理样品可溶性糖方差
Table 7 Analysis of variance of soluble sugar of samples treated with different salt and alkali components
| 处理T | MeanDiff | SEM | q Value | Prob | Sig |
|---|---|---|---|---|---|
| A CK | 18.844 | 1.504 7 | 17.710 76 | 2.97E-08 | 1 |
| B CK | 19.170 | 1.504 7 | 18.017 15 | 2.59E-08 | 1 |
| B A | 0.326 | 0.868 74 | 0.530 69 | 0.998 82 | 0 |
| C CK | 18.858 | 1.483 66 | 17.975 65 | 2.64E-08 | 1 |
| C A | 0.014 33 | 0.831 76 | 0.024 37 | 1 | 0 |
| C B | -0.311 67 | 0.831 76 | 0.529 92 | 0.998 82 | 0 |
| D CK | 21.517 5 | 1.535 73 | 19.814 88 | 1.79E-08 | 1 |
| D A | 2.673 5 | 0.921 44 | 4.103 26 | 0.093 78 | 0 |
| D B | 2.347 5 | 0.921 44 | 3.602 92 | 0.171 35 | 0 |
| D C | 2.659 17 | 0.886 65 | 4.241 37 | 0.078 83 | 0 |
| E CK | 22.77 | 1.504 7 | 21.400 66 | 9.50E-08 | 1 |
| E A | 3.926 | 0.868 74 | 6.391 09 | 0.004 47 | 1 |
| E B | 3.6 | 0.868 74 | 5.860 4 | 0.009 16 | 1 |
| E C | 3.911 67 | 0.831 76 | 6.650 91 | 0.003 15 | 1 |
| E D | 1.252 5 | 0.921 44 | 1.922 32 | 0.749 11 | 0 |
| 处理T | MeanDiff | SEM | q Value | Prob | Sig |
|---|---|---|---|---|---|
| 25 0 | 12.326 | 1.504 | 11.584 | 7.97E-06 | 1 |
| 50 0 | 12.662 | 1.504 | 11.900 | 5.69E-06 | 1 |
| 50 25 | 0.336 | 0.869 | 0.546 | 0.998 | 0 |
| 100 0 | 24.864 | 1.505 | 23.368 | 8.61E-07 | 1 |
| 100 25 | 12.538 | 0.869 | 20.410 | 9.16E-08 | 1 |
| 100 50 | 12.202 | 0.869 | 19.863 | 1.78E-08 | 1 |
| 150 0 | 25.358 | 1.505 | 23.833 | 8.82E-07 | 1 |
| 150 25 | 13.032 | 0.869 | 21.214 | 9.43E-08 | 1 |
| 150 50 | 12.696 | 0.869 | 20.667 | 9.24E-08 | 1 |
| 150 100 | 0.494 | 0.869 | 0.804 | 0.992 | 0 |
| 200 0 | 25.418 | 1.505 | 23.889 | 8.85E-07 | 1 |
| 200 25 | 13.092 | 0.869 | 21.312 | 9.47E-08 | 1 |
| 200 50 | 12.756 | 0.869 | 20.765 | 9.27E-08 | 1 |
| 200 100 | 0.554 | 0.869 | 0.902 | 0.986 | 0 |
| 200 150 | 0.060 | 0.869 | 0.098 | 1 | 0 |
表8 不同盐碱浓度处理样品可溶性糖含量方差
Table 8 Analysis of variance of soluble sugar content of samples treated with different salt and alkali concentrations
| 处理T | MeanDiff | SEM | q Value | Prob | Sig |
|---|---|---|---|---|---|
| 25 0 | 12.326 | 1.504 | 11.584 | 7.97E-06 | 1 |
| 50 0 | 12.662 | 1.504 | 11.900 | 5.69E-06 | 1 |
| 50 25 | 0.336 | 0.869 | 0.546 | 0.998 | 0 |
| 100 0 | 24.864 | 1.505 | 23.368 | 8.61E-07 | 1 |
| 100 25 | 12.538 | 0.869 | 20.410 | 9.16E-08 | 1 |
| 100 50 | 12.202 | 0.869 | 19.863 | 1.78E-08 | 1 |
| 150 0 | 25.358 | 1.505 | 23.833 | 8.82E-07 | 1 |
| 150 25 | 13.032 | 0.869 | 21.214 | 9.43E-08 | 1 |
| 150 50 | 12.696 | 0.869 | 20.667 | 9.24E-08 | 1 |
| 150 100 | 0.494 | 0.869 | 0.804 | 0.992 | 0 |
| 200 0 | 25.418 | 1.505 | 23.889 | 8.85E-07 | 1 |
| 200 25 | 13.092 | 0.869 | 21.312 | 9.47E-08 | 1 |
| 200 50 | 12.756 | 0.869 | 20.765 | 9.27E-08 | 1 |
| 200 100 | 0.554 | 0.869 | 0.902 | 0.986 | 0 |
| 200 150 | 0.060 | 0.869 | 0.098 | 1 | 0 |
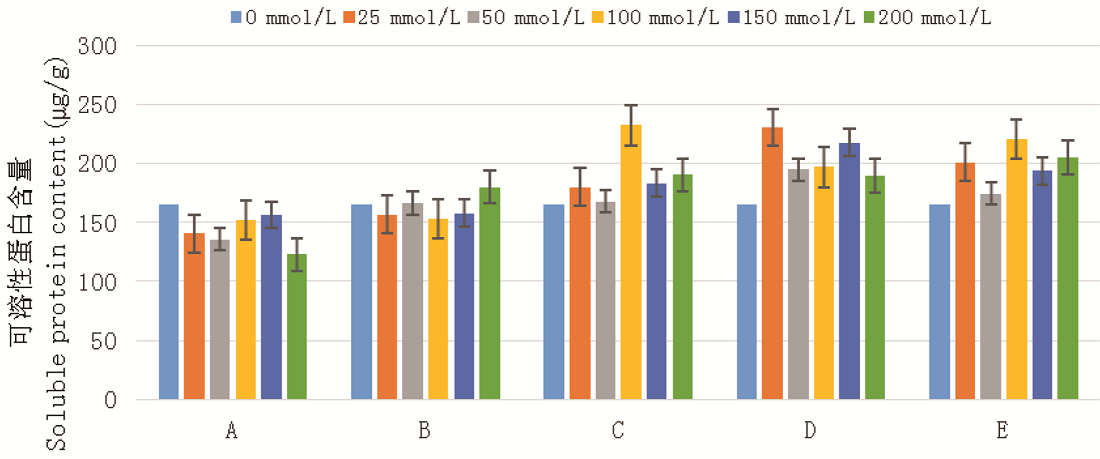
图4 不同处理样品可溶性蛋白含量
Fig.4 Soluble protein content of different samples (μg/g)
| 处理T | MeanDiff | SEM | q Value | Prob | Alpha | Sig |
|---|---|---|---|---|---|---|
| A CK | -33.750 | 20.557 | 2.322 | 0.586 | 0.050 | 0.000 |
| B CK | -11.000 | 20.557 | 0.757 | 0.994 | 0.050 | 0.000 |
| B A | 22.750 | 11.869 | 2.711 | 0.430 | 0.050 | 0.000 |
| C CK | 19.583 | 20.270 | 1.366 | 0.922 | 0.050 | 0.000 |
| C A | 53.333 | 11.363 | 6.638 | 0.003 | 0.050 | 1.000 |
| C B | 30.583 | 11.363 | 3.806 | 0.135 | 0.050 | 0.000 |
| D CK | 18.750 | 20.557 | 1.290 | 0.937 | 0.050 | 0.000 |
| D A | 52.500 | 11.869 | 6.256 | 0.005 | 0.050 | 1.000 |
| D B | 29.750 | 11.869 | 3.545 | 0.183 | 0.050 | 0.000 |
| D C | -0.833 | 11.363 | 0.104 | 1.000 | 0.050 | 0.000 |
| E CK | 19.063 | 20.981 | 1.285 | 0.938 | 0.050 | 0.000 |
| E A | 52.813 | 12.589 | 5.933 | 0.008 | 0.050 | 1.000 |
| E B | 30.063 | 12.589 | 3.377 | 0.221 | 0.050 | 0.000 |
| E C | -0.521 | 12.113 | 0.061 | 1.000 | 0.050 | 0.000 |
| E D | 0.313 | 12.589 | 0.035 | 1.000 | 0.050 | 0.000 |
表9 不同盐碱成分处理样品可溶性蛋白含量方差
Table 9 Analysis of variance of soluble protein content of samples treated with different salt and alkali components
| 处理T | MeanDiff | SEM | q Value | Prob | Alpha | Sig |
|---|---|---|---|---|---|---|
| A CK | -33.750 | 20.557 | 2.322 | 0.586 | 0.050 | 0.000 |
| B CK | -11.000 | 20.557 | 0.757 | 0.994 | 0.050 | 0.000 |
| B A | 22.750 | 11.869 | 2.711 | 0.430 | 0.050 | 0.000 |
| C CK | 19.583 | 20.270 | 1.366 | 0.922 | 0.050 | 0.000 |
| C A | 53.333 | 11.363 | 6.638 | 0.003 | 0.050 | 1.000 |
| C B | 30.583 | 11.363 | 3.806 | 0.135 | 0.050 | 0.000 |
| D CK | 18.750 | 20.557 | 1.290 | 0.937 | 0.050 | 0.000 |
| D A | 52.500 | 11.869 | 6.256 | 0.005 | 0.050 | 1.000 |
| D B | 29.750 | 11.869 | 3.545 | 0.183 | 0.050 | 0.000 |
| D C | -0.833 | 11.363 | 0.104 | 1.000 | 0.050 | 0.000 |
| E CK | 19.063 | 20.981 | 1.285 | 0.938 | 0.050 | 0.000 |
| E A | 52.813 | 12.589 | 5.933 | 0.008 | 0.050 | 1.000 |
| E B | 30.063 | 12.589 | 3.377 | 0.221 | 0.050 | 0.000 |
| E C | -0.521 | 12.113 | 0.061 | 1.000 | 0.050 | 0.000 |
| E D | 0.313 | 12.589 | 0.035 | 1.000 | 0.050 | 0.000 |
| 处理T | MeanDiff | SEM | q Value | Prob | Alpha | Sig |
|---|---|---|---|---|---|---|
| 25 0 | 2.250 | 20.557 | 0.155 | 1.000 | 0.050 | 0.000 |
| 50 0 | -5.500 | 20.557 | 0.378 | 1.000 | 0.050 | 0.000 |
| 50 25 | -7.750 | 11.869 | 0.923 | 0.985 | 0.050 | 0.000 |
| 100 0 | 14.250 | 20.557 | 0.980 | 0.980 | 0.050 | 0.000 |
| 100 25 | 12.000 | 11.869 | 1.430 | 0.907 | 0.050 | 0.000 |
| 100 50 | 19.750 | 11.869 | 2.353 | 0.573 | 0.050 | 0.000 |
| 150 0 | 3.250 | 20.557 | 0.224 | 1.000 | 0.050 | 0.000 |
| 150 25 | 1.000 | 11.869 | 0.119 | 1.000 | 0.050 | 0.000 |
| 150 50 | 8.750 | 11.869 | 1.043 | 0.974 | 0.050 | 0.000 |
| 150 100 | -11.000 | 11.869 | 1.311 | 0.933 | 0.050 | 0.000 |
| 200 0 | -1.500 | 20.557 | 0.103 | 1.000 | 0.050 | 0.000 |
| 200 25 | -3.750 | 11.869 | 0.447 | 0.999 | 0.050 | 0.000 |
| 200 50 | 4.000 | 11.869 | 0.477 | 0.999 | 0.050 | 0.000 |
| 200 100 | -15.750 | 11.869 | 1.877 | 0.766 | 0.050 | 0.000 |
| 200 150 | -4.750 | 11.869 | 0.566 | 0.998 | 0.050 | 0.000 |
表10 不同盐碱浓度处理下样品可溶性蛋白方差
Table 10 Analysis of variance of sample soluble protein under different salt and alkali concentrations
| 处理T | MeanDiff | SEM | q Value | Prob | Alpha | Sig |
|---|---|---|---|---|---|---|
| 25 0 | 2.250 | 20.557 | 0.155 | 1.000 | 0.050 | 0.000 |
| 50 0 | -5.500 | 20.557 | 0.378 | 1.000 | 0.050 | 0.000 |
| 50 25 | -7.750 | 11.869 | 0.923 | 0.985 | 0.050 | 0.000 |
| 100 0 | 14.250 | 20.557 | 0.980 | 0.980 | 0.050 | 0.000 |
| 100 25 | 12.000 | 11.869 | 1.430 | 0.907 | 0.050 | 0.000 |
| 100 50 | 19.750 | 11.869 | 2.353 | 0.573 | 0.050 | 0.000 |
| 150 0 | 3.250 | 20.557 | 0.224 | 1.000 | 0.050 | 0.000 |
| 150 25 | 1.000 | 11.869 | 0.119 | 1.000 | 0.050 | 0.000 |
| 150 50 | 8.750 | 11.869 | 1.043 | 0.974 | 0.050 | 0.000 |
| 150 100 | -11.000 | 11.869 | 1.311 | 0.933 | 0.050 | 0.000 |
| 200 0 | -1.500 | 20.557 | 0.103 | 1.000 | 0.050 | 0.000 |
| 200 25 | -3.750 | 11.869 | 0.447 | 0.999 | 0.050 | 0.000 |
| 200 50 | 4.000 | 11.869 | 0.477 | 0.999 | 0.050 | 0.000 |
| 200 100 | -15.750 | 11.869 | 1.877 | 0.766 | 0.050 | 0.000 |
| 200 150 | -4.750 | 11.869 | 0.566 | 0.998 | 0.050 | 0.000 |
| 生理指标 Index | 不同盐种类处理 Treatment of different salt species | 回归方程 Regression equation | R2 |
|---|---|---|---|
| 脯氨酸含量 Proline content | A | y=10.01x+1.46 | 0.903 8 |
| B | y=160.58x+1.06 | 0.922 5 | |
| C | y=199.39x+0.59 | 0.756 5 | |
| D | y=195.21x+0.46 | 0.518 9 | |
| E | y=86.49x+0.95 | 0.841 3 | |
| 丙二醛含量 Malondialdehyde content | A | y=12.25x+0.07 | 0.832 9 |
| B | y=12.99x+0.07 | 0.818 6 | |
| C | y=12.76x+0.08 | 0.854 9 | |
| D | y=11.92x+0.09 | 0.895 4 | |
| E | y=12.32x+0.11 | 0.928 4 | |
| 可溶性蛋白含量 Soluble protein content | A | y=145.32x-0.04 | 0.183 1 |
| B | y=153.76x+0.09 | 0.502 1 | |
| C | y=182.65x+0.08 | 0.191 2 | |
| D | y=217.76x-0.11 | 0.345 9 | |
| E | y=191.68x+0.07 | 0.245 9 | |
| 可溶性糖含量 Soluble sugar content | A | y=77.12x+1.02 | 0.891 0 |
| B | y=226.39x+0.62 | 0.854 6 | |
| C | y=138.84x+1.095 | 0.976 0 | |
| D | y=86.18x+3.11 | 0.943 9 | |
| E | y=267.29x+1.99 | 0.851 7 |
表11 在不同盐碱种类处理下渗透调节物质与浓度的相关性及回归方程
Table 11 Correlation and regression equation between osmoregulation substance and concentration under different kinds of salt and alkali treatment
| 生理指标 Index | 不同盐种类处理 Treatment of different salt species | 回归方程 Regression equation | R2 |
|---|---|---|---|
| 脯氨酸含量 Proline content | A | y=10.01x+1.46 | 0.903 8 |
| B | y=160.58x+1.06 | 0.922 5 | |
| C | y=199.39x+0.59 | 0.756 5 | |
| D | y=195.21x+0.46 | 0.518 9 | |
| E | y=86.49x+0.95 | 0.841 3 | |
| 丙二醛含量 Malondialdehyde content | A | y=12.25x+0.07 | 0.832 9 |
| B | y=12.99x+0.07 | 0.818 6 | |
| C | y=12.76x+0.08 | 0.854 9 | |
| D | y=11.92x+0.09 | 0.895 4 | |
| E | y=12.32x+0.11 | 0.928 4 | |
| 可溶性蛋白含量 Soluble protein content | A | y=145.32x-0.04 | 0.183 1 |
| B | y=153.76x+0.09 | 0.502 1 | |
| C | y=182.65x+0.08 | 0.191 2 | |
| D | y=217.76x-0.11 | 0.345 9 | |
| E | y=191.68x+0.07 | 0.245 9 | |
| 可溶性糖含量 Soluble sugar content | A | y=77.12x+1.02 | 0.891 0 |
| B | y=226.39x+0.62 | 0.854 6 | |
| C | y=138.84x+1.095 | 0.976 0 | |
| D | y=86.18x+3.11 | 0.943 9 | |
| E | y=267.29x+1.99 | 0.851 7 |
| [1] | 王俊娟, 叶武威, 周大云, 等. 盐胁迫下不同耐盐类型棉花的萌发特性[J]. 棉花学报, 2007,(4):315-317. |
| WANG Junjuan, YE Wuwei, ZHOU Dayun, et al. Germination characteristics of different types of salt-tolerant cotton under salt stress[J]. Cotton Science, 2007,(4):315-317. | |
| [2] | 李双男, 郭慧娟, 王晶, 等. 不同盐碱胁迫对棉花种子萌发的影响[J]. 种子, 2018, 37(1):38-45. |
| LI Shuangnan, GUO Huijuan, WANG Jing, et al. Effects of Different Salt and Alkali Stresses on Cotton Seed Germination[J]. Seeds, 2018, 37(1):38-45. | |
| [3] | 陈莉, 刘连涛, 马彤彤, 等. 褪黑素对盐胁迫下棉花种子抗氧化酶活性及萌发的影响[J]. 棉花学报, 2019, 31(5):438-447. |
| CHEN Li, LIU Liantao, MA Tongtong, et al. Effects of Melatonin on Antioxidant Enzyme Activity and Germination of Cotton Seeds under Salt Stress[J]. Cotton Science, 2019, 31(5):438-447. | |
| [4] | 张倩, 李笑佳, 张淑英. 硅对盐胁迫下棉花幼苗生长和渗透调节系统的影响[J]. 华北农学报, 2019, 34(6):110-117. |
| ZHANG Qian, LI Xiaojia, ZHANG Shuying. Effect of Silicon on Growth and Osmotic Adjustment System of Cotton Seedlings under Salt Stress[J]. Acta Agriculturae Boreali-Sinica, 2019, 34(6):110-117. | |
| [5] |
马宏秀, 王开勇, 张开祥, 等. 棉粕对盐碱胁迫下棉花生理及生长补偿效应[J]. 植物学报, 2019, 54(2):208-216.
DOI |
| MA Hongxiu, WANG Kaiyong, ZHANG Kaixiang, et al. Effects of cotton meal on physiological and growth compensation of cotton under saline-alkali stress[J]. Chinese Bulletin of Botany, 2019, 54(2):208-216. | |
| [6] | 王维. 盐胁迫条件下陆地棉活性氧代谢相关基因的功能研究[D]. 泰安:山东农业大学, 2019. |
| WANG Wei. Functional research on genes involved in active oxygen metabolism in upland cotton under salt stress [D]. Tai'an: Shandong Agricultural University, 2019. | |
| [7] |
严青青, 张巨松, 李星星, 等. 盐碱胁迫对海岛棉种子萌发及幼苗根系生长的影响[J]. 作物学报, 2019, 45(1):100-110.
DOI |
|
YAN Qingqing, ZHANG Jusong, LI Xingxing, et al. Effects of saline-alkali stress on seed germination and seedling root growth of island cotton[J]. Acta Agronomica Sinica, 2019, 45(1):100-110.
DOI |
|
| [8] | Shu H M, Guo S Q, Gong Y Y, et al. Effects of brassinolide on leaf physiological characteristics and differential gene expression profiles of NaCl stressed cotton.[J]. Chinese Journal of Applied Ecology, 2016, 27(1):150-156. |
| [9] | 袁志刚. 外源褪黑素在维持盐胁迫下棉花种子萌发和幼苗生长中的应用[D]. 秦皇岛: 河北科技师范学院, 2018. |
| YUAN Zhigang. Application of exogenous melatonin in maintaining cotton seed germination and seedling growth under salt stress[D]. Qinhuangdao: Hebei Normal University of Science and Technology, 2018. | |
| [10] | 闻志刚. 构树幼苗对盐胁迫的生理响应[D]. 北京:中国林业科学研究院, 2018. |
| WEN Zhigang. Physiological Response of Tree Seedlings to Salt Stress[D]. Beijing: Chinese Academy of Forestry, 2018. | |
| [11] | 李斌彬, 欧阳洁, 王嘉玥, 等. NaCl对旱柳生长发育及部分生理特性的影响[J]. 天津师范大学学报(自然科学版), 2017, 37(6):37-42. |
| LI Binbin, OUYANG Jie, WANG Jiayue, et al. Effects of NaCl on the growth and development and some physiological characteristics of Salix matsudana[J]. Journal of Tianjin Normal University (Natural Science Ed.), 2017, 37(6):37-42. | |
| [12] | 许立志, 庞胜群, 刁明, 等. 隶属函数法评价不同加工番茄品种耐盐性[J]. 新疆农业科学, 2017, 54(5):833-842. |
| XU Lizhi, PANG Shengqun, DIAO Ming, et al. Evaluation of salt tolerance of different processed tomato varieties by membership function method[J]. Xinjiang Agricultural Sciences, 2017, 54(5):833-842. | |
| [13] | 姜丽丽, 吴立萍, 牟芮, 等. 不同用途马铃薯离体条件下耐盐性鉴定[J]. 作物杂志, 2015,(6):59-63. |
| JIANG Lili, WU Liping, MU Rui, et al. Identification of salt tolerance of potato with different purposes in vitro[J]. Crops, 2015,(6):59-63. | |
| [14] | 王磊, 隆小华, 郝连香, 等. 氮素形态对盐胁迫下菊芋幼苗PSⅡ光化学效率及抗氧化特性的影响[J]. 草业学报, 2012, 21(1):133-140. |
| WANG Lei, LONG Xiaohua, HAO Lianxiang, et al. Effects of Nitrogen Forms on Photochemical Efficiency and Antioxidant Characteristics of PSⅡ in Jerusalem Artichoke Seedlings under Salt Stress[J]. Acta Prataculturae Sinica, 2012, 21(1):133-140. | |
| [15] | 王秀玲, 程序, 谢光辉, 等. NaCl胁迫对甜高粱发芽期生理生化特性的影响[J]. 生态环境学报, 2010, 19(10):2285-2290. |
| WANG Xiuling, CHEN Xu, XIE Guanghui, et al. Effects of NaCl stress on physiological and biochemical characteristics of sweet sorghum during germination[J]. Ecology and Environmental Sciences, 2010, 19(10):2285-2290. | |
| [16] | 刘兴亮. 盐碱胁迫对白刺生理生化特性研究[D]. 长春:东北农业大学, 2010. |
| LIU Xingliang. Study on physiological and biochemical characteristics of Nitraria spp. Under saline-alkali stress[D]. Changchun: Northeast Agricultural University, 2010. | |
| [17] | 武俊英. 燕麦耐盐生理特性及农艺措施调控研究[D]. 呼和浩特:内蒙古农业大学, 2009. |
| WU Junying. Study on the physiological characteristics and regulation of agronomic measures of oats[D]. Hohhort: Inner Mongolia Agricultural University, 2009. | |
| [18] | 李才生, 马惠丽, 黄鹏飞. 盐胁迫下不同浓度锌对水稻幼苗生长及细胞膜的影响[J]. 安徽农业科学, 2008,(22):9380-9381, 9427. |
| LI Caisheng, MA Huili, HUANG Pengfei. Effects of Different Zinc Concentrations on Growth and Cell Membrane of Rice Seedlings under Salt Stress[J]. Journal of Anhui Agricultural Sciences, 2008,(22):9380-9381, 9427. | |
| [19] | 许立志. 加工番茄新品种评价及抗逆性鉴定[D]. 石河子:石河子大学, 2017. |
| XU Lizhi. Evaluation of new tomato varieties and stress resistance identification[D]. Shihezi: Shihezi University, 2017. | |
| [20] | 徐隆华. 锌对盐胁迫下小麦幼苗生长的影响及其生理分子机理研究[D]. 西宁:青海师范大学, 2014. |
| XU Longhua. Effect of zinc on the growth of wheat seedlings under salt stress and its physiological molecular mechanism[D]. Xining: Qinghai Normal University, 2014. | |
| [21] | 石庆华, 林嘉鹏, 姚正培, 等. NaCl胁迫对小麦生理生化特征的影响[J]. 新疆农业科学, 2010, 47(7):1479-1484. |
| SHI Qinghua, LIN Jiapeng, YAO Zhengpei, et al. Effects of NaCl Stress on Physiological and Biochemical Characteristics of Wheat[J]. Xinjiang Agricultural Sciences, 2010, 47(7):1479-1484. | |
| [22] | 李晓宇. 盐碱胁迫及外源植物激素对小麦和羊草生长发育的影响[D]. 长春:东北师范大学, 2010. |
| LI Xiaoyu. Effects of saline-alkali stress and exogenous plant hormones on the growth and development of wheat and Leymuschinensis[D]. Changchun: Northeast Normal University, 2010. | |
| [23] | 朱振贤. 几种主要造林树种盐胁迫响应及耐盐机理研究[D]. 南京:南京林业大学, 2007. |
| ZHU Zhenxian. Study on Response to Salt Stress and Salt Tolerance Mechanism of Several Major Afforestation Tree Species[D]. Nanjing: Nanjing Forestry University, 2007. | |
| [24] |
Lai Shujung, Lai Meichin, Lee Renjye, et al. Transgenic Arabidopsis expressing osmolyte glycine betaine synthesizing enzymes from halophilic methanogen promote tolerance to drought and salt stress[J]. Plant Mol. Biol., 2014, 85:429-441.
DOI PMID |
| [25] |
陈振, 张巨松, 严青青, 等. 不同基因型海岛棉根系形态参数对混合盐碱胁迫的响应[J]. 新疆农业科学, 2019, 56(11):1961-1970.
DOI |
|
CHEN Zhen, ZHANG Jusong, YAN Qingqing, et al. Response of root morphological parameters of different genotypes of island cotton to mixed salt and alkali stress[J]. Xinjiang Agricultural Sciences, 2019, 56(11):1961-1970.
DOI |
| [1] | 李阳, 陈静, 刘绍东, 沈倩, 张思平, 葛常伟, 刘瑞华, 马慧娟, 万素梅, 庞朝友. 外源褪黑素对盐胁迫下棉花幼苗生长及光合特性的影响[J]. 新疆农业科学, 2021, 58(8): 1418-1426. |
| [2] | 李笑佳, 张倩, 张淑英. 外源硅对盐胁迫下棉花幼苗光合、荧光及抗氧化酶活性的影响[J]. 新疆农业科学, 2019, 56(5): 873-881. |
| [3] | 杨磊, 靳娟, 冯贝贝, 樊丁宇, 牛莹莹, 郝庆. 高温环境下枣光合特性及相关生理指标日变化[J]. 新疆农业科学, 2018, 55(9): 1639-1646. |
| [4] | 萨吉旦·阿卜杜克日木, 巴特尔·巴克, 艾克来木·艾合买提, 祖力克艳·麻那甫, 王孟辉, 罗那那. 不同沙尘和遮阴处理梯度对4种果树叶片有机渗透调节物质的影响[J]. 新疆农业科学, 2017, 54(8): 1460-1468. |
| [5] | 周娟;范红丽;白丽甜;郑蕊;岳思君. 模拟干旱胁迫对发状念珠藻抗氧化酶系统和渗透调节物质的影响[J]. , 2016, 53(5): 915-920. |
| [6] | 陈娟;张婷;车凤斌;张辉;徐斌. NO处理对哈密瓜果实采后冷害及渗透调节物质的影响[J]. , 2015, 52(12): 2238-2244. |
| [7] | 侯钰荣;安沙舟;侯玉林;陈乐宁. 伊犁绢蒿根系贮存性营养物质和渗透调节物质季节变化及对刈割强度的响应[J]. , 2011, 48(5): 923-930. |
| [8] | 孙宗玖;李培英;安沙舟. 伊犁绢蒿种群对不同刈割干扰的生理响应[J]. , 2011, 48(11): 2102-2108. |
| [9] | 汪习;廖茂森;陈爱红;钟俐. 外源ABA对棉花幼苗抗寒性的影响初探[J]. , 2010, 47(5): 964-968. |
| [10] | 艾力江·麦麦提;齐曼·尤努斯;公勤. NaCl胁迫对三种胡颓子属植物幼苗活性氧清除酶与渗透调节物质含量的影响[J]. , 2008, 45(6): 1069-1075. |
| 阅读次数 | ||||||
|
全文 |
|
|||||
|
摘要 |
|
|||||