

0 引言
【研究意义】自1993年起,新疆棉花总产、单产、种植面积连续27年位居新疆首位[1⇓-3]。研究新疆棉花生产空间格局演化及驱动因素,对于制定科学合理的棉花生产和保障措施具有重要意义。【前人研究进展】棉花种植面积和单产主导着新疆棉花生产的变化[4,5];新疆棉花产业集群尚处于形成阶段[6];种植面积是新疆棉花种植业发展的主要驱动力[7]。【本研究切入点】关于其变化原因的研究主要侧重在棉花产业方面,但是棉花生产布局和空间发展不均衡,有关生产重心变化规律引起其他因素变化的深入研究尚未见报道。需研究新疆棉花生产时空格局演变特征分析。【拟解决的关键问题】以新疆棉区为研究对象,基于1991~2020年新疆棉花生产的面板数据,以新疆区域及主要产棉市(县)为研究基本单元,运用时间序列分析与空间分析相结合方法,分析棉花种植面积、总产量、单产变化趋势,研究新疆棉花生产的时空特征和区域分布及其变化的重要成因,为制定科学合理的棉花生产布局奠定基础。
1 材料与方法
1.1 材料
1.2 方法
1.2.1 线性趋势函数
参照吴海中等[12]方法,利用线性趋势函数和年际变化研究时序上棉花生产规律,建立起某一棉花生产要素(总产量、单产或种植面积)与对应年份的一元线性关系。
1.2.2 面积、单产、互作贡献率分解
参照刘杰安等[13]方法,研究将棉花总产量变化贡献分解为面积、单产和面积单产共同贡献,其中面积贡献率>33.33%时划分为面积主导,单产贡献率>33.33%时划分为单产主导,面积单产互作贡献率>33.33%时划分为面积单产共同作用。
1.2.3 重心迁移
参照刘杰安等[13]方法,采用重心模型法计算不同年份棉花种植面积的重心轨迹,运用MapGis10.0中的平均中心工具计算得到坐标采用点集转线工具将各年重心连接为迁移路径。
1.2.4 棉花面积变化强度
1.3 数据处理
采用GraphPad PrismV5.0软件对数据可视化分析新疆棉花生产时空演化特征,并采用MapGis10.0对数据进行空间分析全国棉花生产的分布特征。
2 结果与分析
2.1 新疆棉花生产的时空演变总体特征
2.1.1 种植面积呈持续增加出现总产量阶段性增长变化
研究表明,30年间棉花种植面积平均年增长2.27倍,从1991年的5.02×10⁴ hm2增加到2020年的1.64×10⁵ hm2,年平均种植面积为9.14×10⁴ hm2,年均增速(4.98%)低于同期棉花总产量(7.99%),高于同期棉花单产(3.37%)的增长率。第一阶段从1993~2010年,种植面积随时间变化呈现波动中递增趋势,从1993年的种植面积3.90×10⁴ hm2增加到2010年的种植面积9.47×10⁴ hm2,18年间同期增加了近1.5倍;第二阶段是从2011~2020年,种植面积随时间变化呈现递增的趋势,从2011年的总面积1.13×10⁵ hm2增长到2020年的总面积1.64×10⁵ hm2,10年间同期增加了45.13%。表1,图1
表1 1991~2020年新疆棉花生产基本数据比较
Tab.1
| 项目Item | 期初值 Initial value | 期末值 Final value | 增长率区间 Growth rate interval(%) | 平均增长率 Average growth rate(%) | 最大增长率Maximum growth rate | 最小增长率Minimum growth rate | |||
|---|---|---|---|---|---|---|---|---|---|
| (%) | 年份Year | (%) | 年份Year | ||||||
| 种植面积 Sown area (104 hm2) | 全疆 | 5.02 | 16.37 | -24.96~52.30 | 4.98 | 52.30 | 2014 | -24.96 | 2002 |
| 南疆 | 4.45 | 14.73 | 91.14~85.36 | 88.39 | 85.36 | 2014 | 91.14 | 2002 | |
| 北疆 | 0.28 | 1.43 | -17.86~87.50 | 7.16 | 87.50 | 1992 | -17.86 | 2014 | |
| 东疆 | 0.29 | 0.21 | -58.33~80.00 | 2.11 | 80.00 | 2003 | -58.33 | 2002 | |
| 总产量 Yield(108 kg) | 全疆 | 4.06 | 30.27 | -14.54~36.91 | 7.99 | 36.91 | 1994 | -14.54 | 2002 |
| 南疆 | 3.59 | 27.28 | 90.47~0.00 | 84.78 | 0.00 | 2018 | 90.47 | 2002 | |
| 北疆 | 0.24 | 2.63 | -23.4~47.80 | 10.00 | 47.80 | 2014 | -23.40 | 1996 | |
| 东疆 | 0.23 | 0.36 | -56.25~71.43 | 4.83 | 71.43 | 2003 | -56.25 | 2002 | |
| 单产 Unit output (103 kg/hm2) | 全疆 | 0.81 | 1.85 | -13.28~28.4 | 3.37 | 28.4 | 1992 | -13.28 | 1996 |
| 南疆 | 1.39 | 1.63 | 0.62~-4.79 | -0.72 | -4.79 | 2011 | 0.62 | 2014 | |
| 北疆 | 0.86 | 1.84 | -25.85~36.05 | 3.39 | 36.05 | 1992 | -25.85 | 1996 | |
| 东疆 | 0.79 | 1.71 | -22.86~44.30 | 3.30 | 44.30 | 1992 | -22.86 | 1996 | |
注:基础数据均来自1990~2021年《新疆统计年鉴》,下同
Note: the basic data are from Xinjiang Statistical Yearbook from 1990 to 2021. The same as below
图1
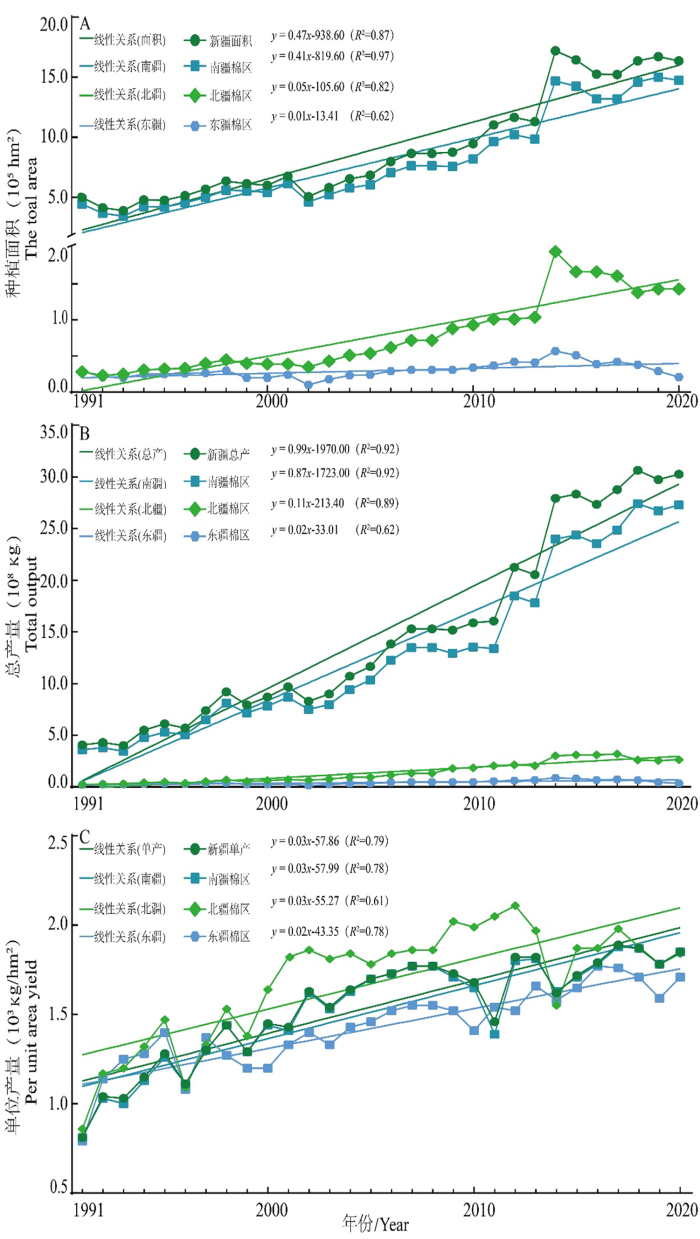
图1
1991~2020年新疆棉花生产数据的比较
Fig.1
Comparison of cotton production data in Xinjiang oasis in recent 30 years (1991-2020)
2.1.2 总产量持续增长且阶段性增长特征明显
研究表明,棉花总产量的阶段性增长特征与种植面积的增长趋势相同。棉花总产量的变化存在着1991~2003年、2004~2013年、2014~2020年等3个明显的增长变化阶段,第一阶段年平均总产量6.92×10⁸ kg,第二阶段年平均总产量1.56×10⁹ kg,第三阶段年平均总产量2.90×10⁹ kg,尤其第二阶段和第三阶段较第一阶段增长了一个数量级,且第三阶段较第二阶段增加1倍。总产量与种植面积变化相似。图1
2.1.3 单产的持续快速增长是推动总产较快增长的驱动因素
2.1.4 面积、单产对棉花总产量的贡献率时间格局演变
研究表明,1991~2020年全疆棉花总产量贡献为单产主导,平均单产贡献率为51.01%;其次为棉花总产量贡献为面积主导,平均面积贡献率为43.72%;面积单产共同作用贡献率最低,平均面积单产共同作用贡献率仅为5.28%。其中1991~2005年全疆棉花总产量贡献为单产主导,平均单产贡献率为79.49%,而2005~2020年全疆棉花总产量贡献为面积主导,平均面积贡献率为72.07%,面积单产共同作用贡献率最低,1.23%~11.56%;南疆、北疆和东疆棉区的贡献率变化也与全疆相似。表2
表2 1991~2020年各时段全疆棉花总产量贡献率变化
Tab.2
| 区域 Region | 时间段 Time interval | 面积变化量 Change in sown area (105 hm2) | 总产量变化量 Change in total production (108 kg) | 单产变化量 Change in yield (103 kg/hm2) | 面积贡献率 Area contribution rate (%) | 单产贡献率 Yield contribution rate(%) | 面积单产共同作用贡献率 Combined effect of area and yield contribution rate(%) |
|---|---|---|---|---|---|---|---|
| 全疆 The whole Xinjiang | 1991~1995 | -0.25 | 2.06 | 0.47 | 7.56 | 88.06 | 4.39 |
| 1996~2000 | 0.87 | 3.01 | 0.34 | 32.06 | 58.12 | 9.82 | |
| 2001~2005 | 0.09 | 1.96 | 0.27 | 6.50 | 92.28 | 1.23 | |
| 2006~2010 | 1.48 | 2.05 | -0.05 | 84.39 | 13.17 | 2.44 | |
| 2011~2015 | 5.41 | 12.28 | 0.26 | 64.89 | 23.56 | 11.56 | |
| 2016~2020 | 1.11 | 2.92 | 0.06 | 66.92 | 30.84 | 2.24 | |
| 南疆 Southern Xinjiang | 1991~1995 | -0.04 | 0.12 | 0.61 | 13.57 | 75.96 | 10.48 |
| 1996~2000 | -0.06 | -0.04 | 0.12 | 62.79 | 30.23 | 6.98 | |
| 2001~2005 | # | 0.03 | 0.13 | # | 100.00 | # | |
| 2006~2010 | 0.05 | 0.04 | -0.11 | 67.02 | 28.13 | 4.85 | |
| 2011~2015 | 0.14 | 0.27 | 0.11 | 79.35 | 14.98 | 5.67 | |
| 2016~2020 | -0.18 | -0.33 | -0.06 | 90.31 | 6.63 | 3.06 | |
| 北疆 North Xinjiang | 1991~1995 | 0.04 | 0.23 | 0.61 | 14.98 | 74.39 | 10.63 |
| 1996~2000 | 0.06 | 0.28 | 0.55 | 23.37 | 64.84 | 11.79 | |
| 2001~2005 | 0.15 | 0.25 | -0.04 | 92.67 | 5.30 | 2.04 | |
| 2006~2010 | 0.31 | 0.71 | 0.15 | 80.35 | 13.10 | 6.55 | |
| 2011~2015 | 0.66 | 1.05 | -0.18 | 81.82 | 10.99 | 7.18 | |
| 2016~2020 | -0.24 | -0.49 | -0.03 | 88.68 | 9.90 | 1.42 | |
| 东疆 East Xinjiang | 1991~1995 | -0.25 | 1.71 | 0.45 | 8.74 | 86.41 | 4.85 |
| 1996~2000 | 0.87 | 2.77 | 0.33 | 35.02 | 54.57 | 10.41 | |
| 2001~2005 | -0.06 | 1.68 | 0.29 | 4.49 | 94.58 | 0.92 | |
| 2006~2010 | 1.12 | 1.30 | -0.08 | 74.71 | 21.84 | 3.45 | |
| 2011~2015 | 4.61 | 10.96 | 0.32 | 58.41 | 28.15 | 13.45 | |
| 2016~2020 | 1.53 | 3.74 | 0.07 | 72.54 | 24.61 | 2.85 |
注:表中“#”表示无数据或者表示该数值<0.01无法显示数据值,下同
Note: "#" in the table means no data, the value is less than 0.01 and the data value cannot be displayed,the same as below
2.2 新疆棉花生产的空间分布格局与地域特征
2.2.1 新疆棉花种植面积增大,区域性分布逐渐集中
研究表明,近30年来新疆棉花生产空间分布表现出不均衡的地域集中性。南疆和北疆棉区主产市(县)棉花种植面积及其占新疆棉花种植面积的比重总体上均呈现上升态势,但东疆棉区主产市(县)棉花种植面积及其占新疆棉花种植面积的比重总体上均呈现下降态势。1991年棉花种植面积超过0.20×10⁴ hm2的棉花生产大县,占总种植面积比超过4%的8个市(县)分别为沙雅县占4.18%,阿瓦提县占4.18%,叶城县占4.38%,麦盖提县占4.38%,沙湾市占4.78%,库车县占5.18%,巴楚县占6.37%,莎车县占8.57%;2000年棉花种植面积超过0.25×10⁴ hm2的棉花生产大县,占总种植面积比超过4%的8个市(县)分别为库车县占4.15%,沙湾市占4.32%,玛纳斯县占4.49%,乌苏市占4.49%,沙雅县占4.49%,阿瓦提县占4.98%,巴楚县占5.15%,莎车县占7.14%;2010年棉花种植面积超过0.40×10⁴ hm2的棉花生产大县,占总种植面积比超过4%的8个市(县)分别为莎车县占4.54%,阿克苏市占4.75%,库尔勒市占4.86%,沙湾市占4.96%,库车县占5.28%,巴楚县占5.39%,沙雅县占6.02%,阿瓦提县占7.07%;2020年棉花种植面积超过0.68×10⁴ hm2的棉花生产大县,占总种植面积比超过4%的8个市(县)分别为巴楚县占4.15%,尉犁县占4.22%,伽师县占5.01%,阿瓦提县占5.86%,库车县占7.09%,乌苏市占7.15%,沙湾市占7.33%,沙雅县占8.19%。其中,北疆棉区的沙湾市,南疆棉区的阿瓦提县、沙雅县、库车县和巴楚县5个产棉大县种植面积一直排名靠前;棉花种植面积增幅最大的3个市(县):尉犁县、伽师县和乌苏市,所占份额逐年增加,与1991年比较,2020年棉花种植面积增幅分别为16.25、4.13和5.50倍。
2.2.2 新疆棉花总产量持续增高,空间分布具有明显的地域集中性
研究表明,1991~2010年,各主产市(县)棉花总产量呈现上升态势,而到2010年以后东疆棉区主产市(县)棉花总产量出现下降。1991年总产量超过0.17×10⁸ kg且占新疆总产量产量比超过4%的7个市(县)分别为阿瓦提县、沙湾市、沙雅县、库车县、麦盖提县、巴楚县和莎车县,分别占4.19%、4.43%、4.43%、4.68%、6.16%、7.14%和8.62%;2000年总产量超过0.35×10⁸ kg且占新疆总产量超过4%的10个市(县)分别为温宿县、阿克苏市、巴楚县、库车县、沙湾市、乌苏市、阿瓦提县、沙雅县、玛纳斯县和莎车县,分别占4.01%、4.24%、4.36%、4.47%、4.93%、5.16%、5.16%、5.16%、5.85%和6.88%;2010年总产量超过0.69×10⁸ kg且占新疆总产量超过4%的9个市(县)分别为库车县、麦盖提县、沙湾市、尉犁县、阿瓦提县、沙雅县、阿克苏市、库尔勒市和巴楚县,分别占4.34%、4.47%、4.78%%、5.1%、5.22%、5.6%、5.66%、5.73%和5.98%;2020年棉花总产量超过1.00×10⁸ kg的棉花生产大县有15个,而总产量超过1.20×10⁸ kg且占新疆总产量超过4%的10个市(县)分别为轮台县、巴楚县、精河县、伽师县、尉犁县、阿瓦提县、乌苏市、库车县、沙湾市和沙雅县,分别占4.00%、4.00%、4.10%、4.69%、4.92%、5.78%、6.9%、7.1%、7.3%和8.39%。其中,北疆棉区的沙湾市,以及南疆棉区阿瓦提县、沙雅县、库车县和巴楚县5个产棉大县总产量一直排名前列,与其种植面积一致。表3
表3 1991~2020年新疆各主产市(县)棉花生产数据的比较
Tab.3
| 棉区 Cotton area | 市(县) City (county) | 1991 | 2000 | |||||||||||
|---|---|---|---|---|---|---|---|---|---|---|---|---|---|---|
| 种植面积 Sown area (104 hm2) | 占总面积 Percentage of total area (%) | 总产量 Yield (108kg) | 占总产量 Percentage of yield (%) | 单产 Unit output (103 kg/hm2) | 较平均单 产增产 Increase in Unit output compared with the average(%) | 种植面积 Sown area (104 hm2) | 占总面积 Percentage of total area (%) | 总产量 Yield (108kg) | 占总产量 Percentage of Yield (%) | 单产 Unit output (103 kg/hm2) | 较平均 单产增产 Increase in Unit output compared with the average(%) | |||
| 南疆 Southern Xinjiang | 库尔勒市 | 0.09 | 1.79 | 0.07 | 1.72 | 0.80 | -1.23 | 0.17 | 2.82 | 0.25 | 2.87 | 1.47 | 1.38 | |
| 轮台县 | 0.04 | 0.80 | 0.02 | 0.49 | 0.53 | -34.57 | 0.09 | 1.50 | 0.13 | 1.49 | 1.52 | 4.83 | ||
| 尉犁县 | 0.04 | 0.80 | 0.03 | 0.74 | 0.85 | 4.94 | 0.18 | 2.99 | 0.28 | 3.21 | 1.56 | 7.59 | ||
| 若羌县 | 0.01 | 0.20 | 0.01 | 0.25 | 1.05 | 29.63 | 0.01 | 0.17 | 0.02 | 0.23 | 1.64 | 13.10 | ||
| 且末县 | 0.02 | 0.40 | 0.01 | 0.25 | 0.65 | -19.75 | 0.05 | 0.83 | 0.07 | 0.80 | 1.46 | 0.69 | ||
| 和硕县 | # | # | # | # | 0.54 | -33.33 | 0.05 | 0.83 | 0.06 | 0.69 | 1.29 | -11.03 | ||
| 博湖县 | # | # | # | # | 0.75 | -7.41 | 0.01 | 0.17 | # | # | 0.77 | -46.9 | ||
| 阿克苏市 | 0.16 | 3.19 | 0.15 | 3.69 | 0.91 | 12.35 | 0.21 | 3.49 | 0.37 | 4.24 | 1.77 | 22.07 | ||
| 温宿县 | 0.11 | 2.19 | 0.06 | 1.48 | 0.59 | -27.16 | 0.21 | 3.49 | 0.35 | 4.01 | 1.65 | 13.79 | ||
| 库车县 | 0.26 | 5.18 | 0.19 | 4.68 | 0.73 | -9.88 | 0.25 | 4.15 | 0.39 | 4.47 | 1.55 | 6.90 | ||
| 沙雅县 | 0.21 | 4.18 | 0.18 | 4.43 | 0.88 | 8.64 | 0.27 | 4.49 | 0.45 | 5.16 | 1.67 | 15.17 | ||
| 新和县 | 0.12 | 2.39 | 0.08 | 1.97 | 0.69 | -14.81 | 0.15 | 2.49 | 0.22 | 2.52 | 1.46 | 0.69 | ||
| 阿瓦提县 | 0.21 | 4.18 | 0.17 | 4.19 | 0.80 | -1.23 | 0.30 | 4.98 | 0.45 | 5.16 | 1.52 | 4.83 | ||
| 柯坪县 | 0.01 | 0.20 | # | # | 0.77 | -4.94 | 0.01 | 0.17 | 0.01 | 0.11 | 1.37 | -5.52 | ||
| 阿图什市 | 0.02 | 0.40 | 0.02 | 0.49 | 0.78 | -3.70 | 0.01 | 0.17 | 0.01 | 0.11 | 1.32 | -8.97 | ||
| 阿克陶县 | 0.05 | 1.00 | 0.03 | 0.74 | 0.64 | -20.99 | 0.04 | 0.66 | 0.04 | 0.46 | 0.99 | -31.72 | ||
| 喀什市 | # | # | # | # | 0.80 | -1.23 | # | # | # | # | 1.55 | 6.90 | ||
| 疏附县 | 0.16 | 3.19 | 0.14 | 3.45 | 0.87 | 7.41 | 0.10 | 1.66 | 0.13 | 1.49 | 1.35 | -6.90 | ||
| 疏勒县 | 0.20 | 3.98 | 0.15 | 3.69 | 0.76 | -6.17 | 0.19 | 3.16 | 0.23 | 2.64 | 1.22 | -15.86 | ||
| 英吉沙县 | 0.10 | 1.99 | 0.08 | 1.97 | 0.77 | -4.94 | 0.07 | 1.16 | 0.08 | 0.92 | 1.04 | -28.28 | ||
| 泽普县 | 0.15 | 2.99 | 0.13 | 3.20 | 0.86 | 6.17 | 0.13 | 2.16 | 0.21 | 2.41 | 1.58 | 8.97 | ||
| 莎车县 | 0.43 | 8.57 | 0.35 | 8.62 | 0.83 | 2.47 | 0.43 | 7.14 | 0.60 | 6.88 | 1.41 | -2.76 | ||
| 叶城县 | 0.22 | 4.38 | 0.15 | 3.69 | 0.70 | -13.58 | 0.16 | 2.66 | 0.21 | 2.41 | 1.32 | -8.97 | ||
| 麦盖提县 | 0.22 | 4.38 | 0.25 | 6.16 | 1.14 | 40.74 | 0.24 | 3.99 | 0.33 | 3.78 | 1.34 | -7.59 | ||
| 岳普湖县 | 0.09 | 1.79 | 0.11 | 2.71 | 1.23 | 51.85 | 0.11 | 1.83 | 0.15 | 1.72 | 1.37 | -5.52 | ||
| 伽师县 | 0.16 | 3.19 | 0.16 | 3.94 | 1.03 | 27.16 | 0.21 | 3.49 | 0.25 | 2.87 | 1.17 | -19.31 | ||
| 巴楚县 | 0.32 | 6.37 | 0.29 | 7.14 | 0.91 | 12.35 | 0.31 | 5.15 | 0.38 | 4.36 | 1.25 | -13.79 | ||
| 和田县 | 0.06 | 1.20 | 0.05 | 1.23 | 0.86 | 6.17 | 0.06 | 1.00 | 0.06 | 0.69 | 0.95 | -34.48 | ||
| 墨玉县 | 0.13 | 2.59 | 0.09 | 2.22 | 0.65 | -19.75 | 0.08 | 1.33 | 0.06 | 0.69 | 0.71 | -51.03 | ||
| 皮山县 | 0.07 | 1.39 | 0.05 | 1.23 | 0.66 | -18.52 | 0.04 | 0.66 | 0.05 | 0.57 | 1.05 | -27.59 | ||
| 策勒县 | 0.05 | 1.00 | 0.03 | 0.74 | 0.75 | -7.41 | 0.04 | 0.66 | 0.04 | 0.46 | 1.28 | -11.72 | ||
| 于田县 | 0.07 | 1.39 | 0.05 | 1.23 | 0.75 | -7.41 | 0.08 | 1.33 | 0.08 | 0.92 | 1.10 | -24.14 | ||
| 棉区 Cotton area | 市(县) City (county) | 2010 | 2020 | |||||||||||
| 种植面积 Sown area (104 hm2) | 占总面积 Percentage of total area (%) | 总产量 Yield (108kg) | 占总产量 Percentage of yield (%) | 单产 Unit output (103 kg/hm2) | 较平均 单产增产 Increase in Unit output compared with the average(%) | 种植面积 Sown area (104 hm2) | 占总面积 Percentage of total area (%) | 总产量 Yield (108kg) | 占总产量 Percentage of Yield (%) | 单产 Unit output (103 kg/hm2) | 较平均 单产增产 Increase in Unit output compared with the average(%) | |||
| 南疆 Southern Xinjiang | 库尔勒市 | 0.46 | 4.86 | 0.91 | 5.73 | 1.97 | 17.26 | 0.60 | 3.67 | 1.19 | 3.93 | 1.96 | 5.95 | |
| 轮台县 | 0.30 | 3.17 | 0.58 | 3.65 | 1.94 | 15.48 | 0.65 | 3.97 | 1.21 | 4.00 | 1.88 | 1.62 | ||
| 尉犁县 | 0.37 | 3.91 | 0.81 | 5.10 | 2.22 | 32.14 | 0.69 | 4.22 | 1.49 | 4.92 | 2.17 | 17.30 | ||
| 若羌县 | 0.03 | 0.32 | 0.05 | 0.31 | 1.78 | 5.95 | 0.03 | 0.18 | 0.05 | 0.17 | 1.80 | -2.70 | ||
| 且末县 | 0.11 | 1.16 | 0.22 | 1.38 | 2.00 | 19.05 | 0.09 | 0.55 | 0.15 | 0.50 | 1.65 | -10.81 | ||
| 和硕县 | 0.13 | 1.37 | 0.26 | 1.64 | 1.93 | 14.88 | 0.02 | 0.12 | 0.03 | 0.10 | 1.73 | -6.49 | ||
| 博湖县 | 0.05 | 0.53 | 0.09 | 0.57 | 1.70 | 1.19 | 0.04 | 0.24 | 0.08 | 0.26 | 1.83 | -1.08 | ||
| 阿克苏市 | 0.45 | 4.75 | 0.90 | 5.66 | 2.03 | 20.83 | 0.62 | 3.79 | 1.09 | 3.6 | 1.78 | -3.78 | ||
| 温宿县 | 0.37 | 3.91 | 0.52 | 3.27 | 1.43 | -14.88 | 0.34 | 2.08 | 0.63 | 2.08 | 1.86 | 0.54 | ||
| 库车县 | 0.50 | 5.28 | 0.69 | 4.34 | 1.39 | -17.26 | 1.16 | 7.09 | 2.15 | 7.10 | 1.86 | 0.54 | ||
| 沙雅县 | 0.57 | 6.02 | 0.89 | 5.60 | 1.56 | -7.14 | 1.34 | 8.19 | 2.54 | 8.39 | 1.90 | 2.70 | ||
| 新和县 | 0.33 | 3.48 | 0.54 | 3.40 | 1.62 | -3.57 | 0.56 | 3.42 | 1.02 | 3.37 | 1.84 | -0.54 | ||
| 阿瓦提县 | 0.67 | 7.07 | 0.83 | 5.22 | 1.25 | -25.60 | 0.96 | 5.86 | 1.75 | 5.78 | 1.83 | -1.08 | ||
| 柯坪县 | 0.05 | 0.53 | 0.09 | 0.57 | 1.73 | 2.98 | 0.08 | 0.49 | 0.16 | 0.53 | 1.98 | 7.03 | ||
| 阿图什市 | 0.02 | 0.21 | 0.03 | 0.19 | 1.49 | -11.31 | 0.06 | 0.37 | 0.12 | 0.40 | 1.90 | 2.70 | ||
| 阿克陶县 | 0.04 | 0.42 | 0.06 | 0.38 | 1.49 | -11.31 | 0.04 | 0.24 | 0.06 | 0.20 | 1.78 | -3.78 | ||
| 喀什市 | # | # | # | # | # | # | 0.15 | 0.92 | 0.23 | 0.76 | 1.56 | -15.68 | ||
| 疏附县 | 0.03 | 0.32 | 0.05 | 0.31 | 1.57 | -6.55 | 0.03 | 0.18 | 0.06 | 0.20 | 1.76 | -4.86 | ||
| 疏勒县 | 0.12 | 1.27 | 0.16 | 1.01 | 1.36 | -19.05 | 0.36 | 2.20 | 0.60 | 1.98 | 1.66 | -10.27 | ||
| 英吉沙县 | 0.07 | 0.74 | 0.09 | 0.57 | 1.39 | -17.26 | 0.15 | 0.92 | 0.27 | 0.89 | 1.77 | -4.32 | ||
| 泽普县 | 0.08 | 0.84 | 0.07 | 0.44 | 0.93 | -44.64 | 0.05 | 0.31 | 0.09 | 0.30 | 1.75 | -5.41 | ||
| 莎车县 | 0.43 | 4.54 | 0.53 | 3.34 | 1.22 | -27.38 | 0.47 | 2.87 | 0.77 | 2.54 | 1.66 | -10.27 | ||
| 叶城县 | 0.07 | 0.74 | 0.09 | 0.57 | 1.40 | -16.67 | 0.17 | 1.04 | 0.28 | 0.93 | 1.69 | -8.65 | ||
| 麦盖提县 | 0.37 | 3.91 | 0.71 | 4.47 | 1.92 | 14.29 | 0.36 | 2.20 | 0.67 | 2.21 | 1.84 | -0.54 | ||
| 岳普湖县 | 0.13 | 1.37 | 0.20 | 1.26 | 1.50 | -10.71 | 0.44 | 2.69 | 0.75 | 2.48 | 1.71 | -7.57 | ||
| 伽师县 | 0.17 | 1.80 | 0.27 | 1.70 | 1.62 | -3.57 | 0.82 | 5.01 | 1.42 | 4.69 | 1.73 | -6.49 | ||
| 巴楚县 | 0.51 | 5.39 | 0.95 | 5.98 | 1.88 | 11.90 | 0.68 | 4.15 | 1.21 | 4.00 | 1.77 | -4.32 | ||
| 和田县 | 0.03 | 0.32 | 0.05 | 0.31 | 1.92 | 14.29 | # | # | # | # | 1.00 | -45.95 | ||
| 墨玉县 | 0.04 | 0.42 | 0.08 | 0.50 | 1.90 | 13.10 | 0.01 | 0.06 | 0.01 | 0.03 | 1.28 | -30.81 | ||
| 皮山县 | 0.04 | 0.42 | 0.07 | 0.44 | 1.91 | 13.69 | 0.01 | 0.06 | 0.01 | 0.03 | 1.77 | -4.32 | ||
| 策勒县 | 0.03 | 0.32 | 0.06 | 0.38 | 1.89 | 12.50 | # | # | 0.01 | 0.03 | 1.85 | 0.00 | ||
| 于田县 | 0.07 | 0.74 | 0.12 | 0.76 | 1.80 | 7.14 | 0.01 | 0.06 | 0.01 | 0.03 | 1.74 | -5.95 | ||
| 棉区 Cotton area | 市(县) City (county) | 1991 | 2000 | |||||||||||
| 种植面积 Sown area (104 hm2) | 占总面积 Percentage of total area (%) | 总产量 Yield (108kg) | 占总产量 Percentage of yield (%) | 单产 Unit output (103 kg/hm2) | 较平均 单产增产 Increase in Unit output compared with the average(%) | 种植面积 Sown area (104 hm2) | 占总面积 Percentage of total area (%) | 总产量 Yield (108kg) | 占总产量 Percentage of Yield (%) | 单产 Unit output (103 kg/hm2) | 较平均 单产增产 Increase in Unit output compared with the average(%) | |||
| 北疆 North Xinjiang | 克拉玛依市 | # | # | # | # | 0.72 | -11.11 | 0.03 | 0.50 | 0.04 | 0.46 | 1.34 | -7.59 | |
| 昌吉市 | 0.01 | 0.20 | # | # | 0.72 | -11.11 | 0.10 | 1.66 | 0.13 | 1.49 | 1.28 | -11.72 | ||
| 博乐市 | 0.11 | 2.19 | 0.08 | 1.97 | 0.75 | -7.41 | 0.13 | 2.16 | 0.21 | 2.41 | 1.64 | 13.10 | ||
| 精河县 | 0.11 | 2.19 | 0.10 | 2.46 | 0.88 | 8.64 | 0.15 | 2.49 | 0.24 | 2.75 | 1.65 | 13.79 | ||
| 阜康市 | # | # | # | # | 0.40 | -50.62 | 0.02 | 0.33 | 0.02 | 0.23 | 1.22 | -15.86 | ||
| 呼图壁县 | 0.02 | 0.40 | 0.01 | 0.25 | 0.56 | -30.86 | 0.15 | 2.49 | 0.24 | 2.75 | 1.56 | 7.59 | ||
| 玛纳斯县 | 0.11 | 2.19 | 0.08 | 1.97 | 0.73 | -9.88 | 0.27 | 4.49 | 0.51 | 5.85 | 1.88 | 29.66 | ||
| 奎屯市 | # | # | # | # | # | # | # | # | # | # | 1.50 | 3.45 | ||
| 霍城县 | 0.02 | 0.40 | 0.01 | 0.25 | 0.56 | -30.86 | 0.02 | 0.33 | 0.02 | 0.23 | 1.13 | -22.07 | ||
| 乌苏市 | 0.18 | 3.59 | 0.13 | 3.20 | 0.71 | -12.35 | 0.27 | 4.49 | 0.45 | 5.16 | 1.64 | 13.10 | ||
| 沙湾县 | 0.24 | 4.78 | 0.18 | 4.43 | 0.73 | -9.88 | 0.26 | 4.32 | 0.43 | 4.93 | 1.65 | 13.79 | ||
| 和布克赛尔 蒙古自治县 | # | # | # | # | # | # | # | # | # | # | 1.41 | -2.76 | ||
| 察布查尔 锡伯自治县 | 0.01 | 0.20 | # | # | 0.47 | -41.98 | 0.01 | 0.17 | 0.01 | 0.11 | 0.86 | -40.69 | ||
| 东疆 East Xinjiang | 吐鲁番高昌区 | 0.10 | 1.99 | 0.07 | 1.72 | 0.75 | -7.41 | 0.05 | 0.83 | 0.06 | 0.69 | 1.16 | -20.00 | |
| 鄯善县 | 0.07 | 1.39 | 0.06 | 1.48 | 0.75 | -7.41 | 0.03 | 0.50 | 0.05 | 0.57 | 1.34 | -7.59 | ||
| 托克逊县 | 0.09 | 1.79 | 0.08 | 1.97 | 0.87 | 7.41 | 0.05 | 0.83 | 0.07 | 0.80 | 1.22 | -15.86 | ||
| 哈密伊州区 | 0.03 | 0.60 | 0.02 | 0.49 | 0.78 | -3.70 | 0.06 | 1.00 | 0.07 | 0.80 | 1.19 | -17.93 | ||
| 棉区 Cotton area | 市(县) City (county) | 2010 | 2020 | |||||||||||
| 种植面积 Sown area (104 hm2) | 占总面积 Percentage of total area (%) | 总产量 Yield (108kg) | 占总产量 Percentage of yield (%) | 单产 Unit output (103 kg/hm2) | 较平均 单产增产 Increase in Unit output compared with the average(%) | 种植面积 Sown area (104 hm2) | 占总面积 Percentage of total area (%) | 总产量 Yield (108kg) | 占总产量 Percentage of Yield (%) | 单产 Unit output (103 kg/hm2) | 较平均 单产增产 Increase in Unit output compared with the average(%) | |||
| 北疆 North Xinjiang | 克拉玛依市 | 0.07 | 0.74 | 0.11 | 0.69 | 1.53 | -8.93 | 0.13 | 0.79 | 0.25 | 0.83 | 1.88 | 1.62 | |
| 昌吉市 | 0.23 | 2.43 | 0.38 | 2.39 | 1.61 | -4.17 | 0.31 | 1.89 | 0.54 | 1.78 | 1.72 | -7.03 | ||
| 博乐市 | 0.17 | 1.80 | 0.37 | 2.33 | 2.13 | 26.79 | 0.31 | 1.89 | 0.59 | 1.95 | 1.92 | 3.78 | ||
| 精河县 | 0.27 | 2.85 | 0.58 | 3.65 | 2.14 | 27.38 | 0.64 | 3.91 | 1.24 | 4.10 | 1.94 | 4.86 | ||
| 阜康市 | # | # | # | # | 1.23 | -26.79 | 0.14 | 0.86 | 0.26 | 0.86 | 1.82 | -1.62 | ||
| 呼图壁县 | 0.25 | 2.64 | 0.43 | 2.71 | 1.70 | 1.19 | 0.53 | 3.24 | 1.15 | 3.80 | 2.15 | 16.22 | ||
| 玛纳斯县 | 0.28 | 2.96 | 0.58 | 3.65 | 2.04 | 21.43 | 0.56 | 3.42 | 1.11 | 3.67 | 2.00 | 8.11 | ||
| 奎屯市 | 0.02 | 0.21 | 0.01 | 0.06 | 0.90 | -46.43 | 0.12 | 0.73 | 0.23 | 0.76 | 1.98 | 7.03 | ||
| 霍城县 | 0.01 | 0.11 | 0.01 | 0.06 | 1.14 | -32.14 | # | # | # | # | 1.61 | -12.97 | ||
| 乌苏市 | # | # | # | # | # | # | 1.17 | 7.15 | 2.09 | 6.90 | 1.78 | -3.78 | ||
| 沙湾县 | 0.47 | 4.96 | 0.76 | 4.78 | 1.61 | -4.17 | 1.20 | 7.33 | 2.21 | 7.30 | 1.87 | 1.08 | ||
| 和布克赛尔 蒙古自治县 | 0.07 | 0.74 | 0.10 | 0.63 | 1.52 | -9.52 | 0.06 | 0.37 | 0.10 | 0.33 | 1.77 | -4.32 | ||
| 察布查尔 锡伯自治县 | 0.08 | 0.84 | 0.09 | 0.57 | 1.17 | -30.36 | # | # | # | # | 1.54 | -16.76 | ||
| 东疆 East Xinjiang | 吐鲁番高昌区 | 0.04 | 0.42 | 0.05 | 0.31 | 1.28 | -23.81 | # | # | # | # | 1.30 | -29.73 | |
| 鄯善县 | 0.06 | 0.63 | 0.08 | 0.50 | 1.37 | -18.45 | # | # | 0.01 | 0.03 | 1.50 | -18.92 | ||
| 托克逊县 | 0.09 | 0.95 | 0.11 | 0.69 | 1.13 | -32.74 | 0.05 | 0.31 | 0.07 | 0.23 | 1.47 | -20.54 | ||
| 哈密伊州区 | 0.15 | 1.58 | 0.24 | 1.51 | 1.64 | -2.38 | 0.15 | 0.92 | 0.28 | 0.93 | 1.86 | 0.54 | ||
2.2.3 新疆棉花单产逐渐向高产方向转变,高产市(县)数量明显增加
研究表明,新疆棉花单产逐渐向高产方向转变,高产市(县)数量明显增加,新疆主要棉花生产市(县)棉花单产水平整体上呈现持续增长的趋势;1991年棉花单产≥1.00×10³ kg/hm2主要集中在南疆棉区:伽师县、若羌县、麦盖提县和岳普湖县,分别较同期新疆平均单产增加27.16%、29.63%、40.74%、51.85%;2000年棉花单产≥1.00×103 kg/hm2市(县)数量明显增加,单产不断提高,保持持续增长的态势仅仅只有5市(县)棉花单产<1.00×103 kg/hm2:墨玉县、博湖县、察布查尔锡伯自治县、和田县和阿克陶县;2010年几乎全部主产棉市(县)超过1.00×103 kg/hm2,而棉花单产达到≥2.00×104 kg/hm2有6个市(县):且末县、阿克苏市、玛纳斯县、博乐市、精河县和尉犁县,创历史新高;2020年主产棉市(县)单产持续增加,而新疆棉花单产突破2.00×104 kg/hm2,而且尉犁县棉花单产突破2.22×103 kg/hm2;2020年主产棉省区单产持续增加,全部主产棉市(县)超过1.00×103 kg/hm2,棉花单产达到≥2.00×104 kg/hm2仅有有三个市(县):玛纳斯县、呼图壁县和尉犁县。表3
2.3 新疆生产重心的演变特征
研究表明,近30年来新疆主产市(县)棉花生产重心具有明显的集中于南疆棉区;新疆棉花种植面积重心整体由喀什地区缓慢移动,棉花生产重心布局总体呈现“由西向东北”转移,逐渐向阿克苏地区集中。图2
图2
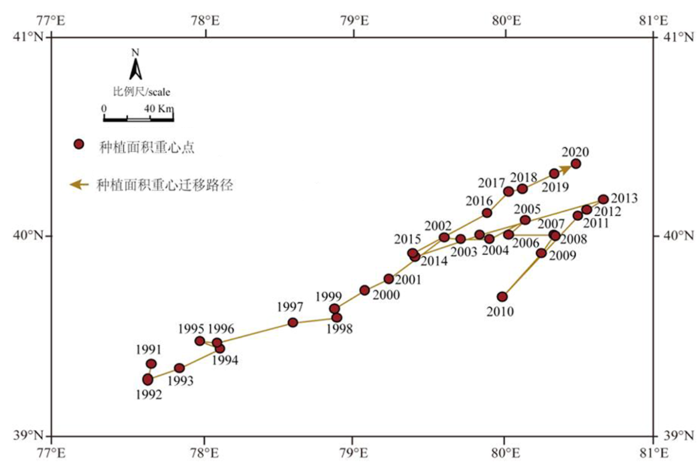
图2
1991~2020年新疆棉花种植面积重心迁移路径变化
Fig.2
Variations of the gravity of cotton area of Xinjiang in 1991-2020
2.4 棉花种植面积变化幅度的演变特征
研究表明,与1991年比较,1995年新疆总种植面积增加-4.98%,东疆、北疆和南疆种植面积分别增加-13.79%、14.29%和-5.62%,其中种植面积无变化仅有8个市(县),其余41个市(县)种植面积大幅缩减,缩减超1倍的有10个市(县);与1996年比较,2000年新疆棉花总种植面积增加16.89%,东疆、北疆和南疆种植面积分别增减-23.08%、18.18%和19.08%,其中种植面积无变化有17个市(县),其余32个市(县)种植面积大幅增长,增长超10倍的有17个市(县);与2001年比较,2005年新疆总种植面积增加1.33%,东疆无变化,北疆和南疆种植面积分别增减38.46%和-0.98%,其中种植面积无变化有11个市(县),17个市(县)种植面积大幅增长,增长超1倍的有6个市(县),13个市(县)种植面积大幅缩减;与2006年比较,2010年新疆总种植面积增加18.52%,东疆、北疆和南疆种植面积分别增加17.24%、50%和15.82%,其中种植面积无变化有14个市(县),17个市(县)种植面积大幅增长,增长超1倍的仅有2个市(县),8个市(县)种植面积大幅缩减,缩减超1倍的仅有2个市(县);与2011年比较,2015年新疆总种植面积增加49.05%,东疆、北疆和南疆种植面积分别增加37.84%、65.35%和47.77%,其中种植面积无变化有5个市(县),28个市(县)种植面积大幅增长,增长超1倍的有13个市(县),10个市(县)种植面积大幅缩减,缩减超1倍的仅有1个市(县);与2016年比较,2020年新疆总种植面积增加7.27%,其中东疆、北疆和南疆种植面积增减为-46.15%、-14.37%和11.59%,其中种植面积无变化有5个市(县),12个市(县)种植面积大幅增长,增长超1倍的有4个市(县),19个市(县)种植面积大幅缩减,缩减超1倍的有5个市(县)。
3 讨论
研究发现,无论全疆层面还是区域棉区,棉花总产量贡献为单产为主导,其次为面积,面积单产共同作用贡献率最低,与前人[18]研究结论相似。不同的是研究区内棉花单产和面积变化波动较大,1991~2005全疆棉花总产量贡献为单产大于面积的贡献作用,而2005~2020年全疆棉花总产量贡献为面积大于单产的贡献作用。
截至2017年,新疆棉区膜下滴灌技术的应用面积已经达到2.50×10⁶ hm2,大幅度提高棉花水资源利用效率[27]。“矮·密·早·膜”栽培技术模式不断完善以及生产规模化、标准化、集约化、轻简化水平稳步提升,尤其是从全程机械化、种子自动化精选与包衣、大型农机配套北斗导航系统实现精准种植、耕地、自动化水肥一体化滴灌系统到无人机飞防等生产管理过程实现了现代化,进而演变成如今棉花“密·矮·早·膜·滴灌·机采”或“宽·早·优”栽培技术体系,提高农业生产效率、增加棉花生产总产量。新技术的广泛运用促进棉花生产从粗放式增长向集约式增长转变,提高了劳动效率,节省了生产成本,大幅度降低了劳动强度,促进了新疆棉花生产的持续发展[28]。
4 结论
4.1 近30年新疆棉花总产量增加6.46倍,总产量大幅增加,种植面积扩大2.27倍,是总产量增长的主要原因,棉花单产增长1.28倍,是推动总产量较快增长的重要驱动因素,棉花总产量贡献为单产为主导,其次为面积,面积单产共同作用为最低。
4.1 近30年来全疆棉花主要市(县)发生改变,棉花主要生产市(县)分布呈现“东减南增北平稳”的状态,东疆棉区棉花种植面积下降0.08×10⁴ hm2,棉花种植面积仅占全疆总面积1.28%,地位逐步下降,而北疆棉区棉花种植面积增加1.15×10⁴ hm2,占全疆总面积的 8.55%。
参考文献
棉花SPAD值推荐施氮模型应用与修正
[J].
【目的】研究棉花SPAD值推荐施氮模型应用与修正,为棉花SPAD法推荐施肥模型在田间应用的准确性、普适性及合理性提供科学依据。【方法】采用田间小区试验,设3个处理:按照棉花生育时期测定SPAD值推荐施氮(N<sub>1</sub>);按照棉花叶龄测定SPAD值推荐施氮(N<sub>2</sub>);按当地高产模式推荐施氮(N<sub>3</sub>);对比SPAD值、产量构成指标等数据变化特征,修正SPAD值推荐施氮模型。【结果】N<sub>1</sub>处理与SPAD值关系式为y=0.090 3x+46.618, R<sup>2</sup>=0.855;N<sub>2</sub>处理与SPAD值关系式为y=0.108 6x+48.666,R<sup>2</sup>=0.765,N<sub>1</sub>处理的追氮量与SPAD值的相关性要高于N<sub>2</sub>处理;M<sub>1</sub>推荐的N<sub>1</sub>处理追氮量与M<sub>2</sub>推荐的N<sub>2</sub>处理追氮量对产量的影响差异不显著;N<sub>1</sub>的追氮量417.45 kg/hm<sup>2</sup>高于当地高产的追氮量,N<sub>2</sub>的285.40 kg/hm<sup>2</sup>低于当地高产的追氮量,但是N<sub>1</sub>和N<sub>2</sub>的产量均明显低于当地高产产量;在棉花各个生育时期,N<sub>1</sub>与N<sub>2</sub>的追肥量与棉花需肥量趋势基本一致,但是各时期N<sub>1</sub>的追肥量高于N<sub>2</sub>的追肥量。【结论】棉花SPAD值推荐施氮模型具有科学性、可应用性,但在土壤、气候、管理模式变化时需要对模型参数进行修正,才能达到SPAD值与施氮量的最大相关性。修正SPAD值推荐施氮模型时可以利用原有模型的推荐施肥量、当地多年高产施肥量,通过反推快速得到当年就能使用的新推荐施肥公式。
Application and modification of recommended nitrogen application model for SPAD value of cotton
[J].<b>【Objective】</b> The purpose of the thesis is to provide scientific basis for the accuracy, universality and rationality of applying cotton SPAD method recommended fertilization model.<b>【Methods】</b> This thesis establishes three treatments through field plot experiment: Determine recommended nitrogen application (N<sub>1</sub>) based on the SPAD value of cotton growth period; Determine recommended nitrogen application (N<sub>2</sub>) in line with the SPAD value of cotton leaf age (N<sub>2</sub>); Carry out recommended nitrogen application (N<sub>3</sub>) by following the local high yield model.The recommended nitrogen application model of SPAD value is modified through observing and comparing the variation features of SPAD value, yield composition index and so on.<b>【Results】</b> It is <i>y=0.090,3x+46.618, R<sup>2</sup></i>=0.855 for the correlation between N<sub>1</sub> treatment and SPAD value; and is <i>y=0.108,6x+48.666, R<sup>2</sup></i>=0.765 for the correlation between N<sub>2</sub> treatment and SPAD value, in which the correlation between nitrogen recovery and SPAD value of N<sub>1</sub> treatment was higher than that of N<sub>2</sub> treatment. No significant difference in the effect of nitrogen recovery amount on yield between the treatment of N<sub>1</sub> recommended by M<sub>1</sub> and the treatment of N<sub>2</sub> recommended by M<sub>2</sub>; The nitrogen recovery amount 417.45 kg/hm<sup>2</sup> of of N<sub>1</sub> is higher than local high-yield nitrogen recovery amount, and the 285.40 kg/hm<sup>2</sup> of N<sub>2</sub> is lower than the local high-yield nitrogen recovery amount, while the yield of N<sub>1</sub> and N<sub>2</sub> is obviously lower than that of local high yield. During each growth period of cotton, the trend of topdressing of N<sub>1</sub> and N<sub>2</sub> is basically consistent with that of cotton, while the topdressing of N<sub>1</sub> is higher than that of N<sub>2</sub> in each period.<b>【Conclusion】</b> It is scientific and applicable for the recommended nitrogen application model of cotton SPAD value, while it needs to modify the model parameters at the change of soil, climate and management mod to reach the maximum correlation between SPAD value and nitrogen application amount. It is able to quickly obtain the new formula of recommended fertilization that can be used in the current year by reverse deduction when modifying recommended nitrogen application model of SPAD value though the use of the recommended fertilization amount of the original model and the local high yield fertilization amount with many years.
新疆棉花生产地位分析
[J].
Analysis of cotton production status in Xinjiang
[J].
新疆机采棉发展回顾, 现状分析及措施建议
[J].
Review, status and measures of xinjiang machine-picked cotton
[J].Cotton is a pillar industry in Xinjiang and has an important strategic position for Chinas economic development, which directly related to the implementation of Xinjiangs rural revitalization strategy and the enthusiasm of cotton farmers. In recent years, the large-scale popularization and application of machine-picked cotton has greatly improved the efficiency of picking cotton and alleviated the problem of labor shortage, but the profit of cotton farmers has not increased due to the price of cotton hovering at a low level. By reviewing the development process of Xinjiang machine-picked cotton, the development status of Xinjiang machine-picked cotton was briefly described, and the problems and development suggestions of Xinjiang machine-picked cotton development were put forward. It should aim to provide solutions for the development of Xinjiangs machine-picked cotton industry and promote Xinjiang sustainable development of the cotton industry.
新疆棉花种植面积时空格局演变特征及驱动机制研究
[J].
Spatio-temporal Pattern Dynamic of Cotton Plantation in Xinj iang and its Driving Forces
[J].
新疆棉区生产空间格局演化及驱动因素分析
[J].
Spatio temporal pattern and its driving facdtors of cotton production in Xinjiang
[J].
基于CR4分析的新疆棉花产业集群形成中的自然环境因素限制和影响分析
[J].
Restrictions and impact analysis of natural environmental factors on xinjiang cotton industry cluster formation based on the analysis of CR4
[J].
新疆棉花种植业地理集聚特征及影响因素研究
[J].新疆是我国最大的产棉基地, 研究新疆棉花种植业地理集聚特征对调整和优化农业结构布局、农民增收、促进棉花生产的可持续发展具有重要意义。本文基于1988—2016年的新疆棉花生产数据, 使用区位商、区位基尼系数和空间自相关分析探究新疆棉花种植业发展的时空变化特征, 并运用空间面板数据模型定性、定量地分析了各影响因素对新疆棉花种植业地理集聚的影响程度, 揭示了新疆棉花种植业发展的主要驱动因素。结果表明, 新疆棉花种植面积经历了持续增长(1988—1999年)、缓慢减少(2000—2004年)以及波动增长(2005—2016年) 3个阶段, 2016年已占全国种植面积的3/5, 其专业化集聚水平自1992年起均高于全国其他地区, 主导地位日益增强; 新疆棉花种植业的区域特征明显, 南疆棉区的变化主导新疆棉花种植业的变化; 新疆棉花种植业的集聚水平自1988年起呈现出波动中下降后缓慢回升的趋势, 其高值集聚区由喀什地区转移至阿克苏地区的库车县、新和县等地, 高-低集聚、低-高集聚及低低集聚变化不大; 推动新疆棉花种植业地理集聚发展的主要因素有生产性土地面积比重、棉花比较收益、机械化水平以及政策因素。
Characteristics and influencing factors of geographical agglomeration of cotton plantation in Xinjiang
[J].Xinjiang is the largest cotton production base in China. The study on the geographical agglomeration characteristics of cotton planting in Xinjiang is of great significance in adjusting and optimizing the agricultural structure distribution of cotton production, increasing farmers’ income, and promoting the sustainable development of cotton. Based on the cotton production data of Xinjiang from 1988 to 2016, we explored the spatial-temporal change characteristics of cotton plantation by Location quotient, Gini coefficient, and spatial autocorrelation analysis, qualitatively and quantitatively analyzed various influence factors on the geographical agglomeration of cotton plantation by spatial panel data model, and revealed the main driving force of cotton planting industry in Xinjiang. The cotton planting area in Xinjiang experienced three stages, including continuous growth (1988-1999), slow decrease (2000-2004) and fluctuating growth (2005-2016). In 2016, the cotton planting area accounted for nearly 3/5 of the total area in China, and its professional agglomeration level was higher than that of other regions in China, with the increasingly strengthened leading position since 1992. The regional characteristics of cotton planting industry in Xinjiang were obvious. The change of cotton area in southern Xinjiang dominated the change of cotton plantation in Xinjiang. The agglomeration level of cotton plantation in Xinjiang showed a trend of slow recovery after a decline in fluctuation since 1988. The high aggregation (H-H) area transferred from Kashgar area to Kuqa and Xinhe in Aksu area, at the same time, the changes of high-low cluster, low-high cluster and low-low cluster were not significant. The main factors promoting the geographical agglomeration of cotton planting in Xinjiang included the proportion of productive land area, cotton comparative income, mechanization level and policy factors.
农业化肥减量及生物肥料替代可行性研究-来自新疆棉区调查数据的实证
[J].推进化肥减施增效是实现中国农业绿色高质量发展的关键途径。本文以新疆棉花为例,基于2000—2020年棉花化肥施用量及技术、资本、劳动力投入时序数据,构建生产函数考察了新疆棉花单位面积化肥施用强度变化及其对棉花单产提升的贡献作用,并利用2015—2020年不同植棉区化肥和生物肥料施肥区的微观定位调查数据,采用熵权法构建肥料应用效益评价指标体系,对两种肥料的综合效益做出总体评判,并对经济效益(棉花产量、黄萎病害发生率)和生态效益(土壤有机质、微生物数量)及两种肥料施用成本进行具体比较,探讨了生物肥替代化肥的可行性及其实现机制。研究表明:① 2000—2020年间新疆棉花单位面积化肥施用强度呈不断上升态势,高于同期国内大部分植棉省份,自2016年起趋于减缓和平稳,施肥量浮动在585 kgN/hm<sup>2</sup>左右。② 2000—2010年随着单位面积化肥施用强度的增加,对棉花单产增加呈正向促进作用;而2010—2020年,单位面积化肥施用强度增加对棉花单产提高的贡献率为-21.29%,表明持续增加化肥用量对棉花单产提高已呈现负效应。③ 生物肥料施肥区生态效益优势更突出,但经济效益低于化肥区,两种肥料的综合效益随使用年限增加差距趋于缩小;较化肥组,研究期内不同植棉区生物肥组棉花单产降低3%~8%,黄萎病害发病率降幅27.75%~58.20%,土壤有机质含量提高了14.59%~28.54%,土壤微生物数量显著增加;生物肥单位施用成本高于化肥14%~19%。根据生物肥生态属性及作用机理,结合农户经济理性及传统的化肥依赖,建议在生物肥推广初期,实行一定的政策激励或生态补偿,同时积极引导和培育农户亲环境意识,农业化肥逐步减量及生物肥替代具有理论与实践可行性。
Feasibility study on reduction of agricultural chemical fertilizer and substitution of bio-fertilizer: An empirical study of cotton survey data in Xinjiang
[J].Reducing chemical fertilizer and increasing biofertilizer are important ways to achieve green agricultural development in China. This paper used production function to investigate the evolution of cotton chemical fertilizer application intensity and its effect on cotton yield per unit area in Xinjiang from 2000 to 2020. Based on the survey data from 2015 to 2020, an evaluation index system was constructed using entropy weight method to evaluate the comprehensive benefits of two types of fertilizers. Furthermore, the feasibility and realization mechanism of using biofertilizer to replace chemical fertilizer were discussed. The results showed that: (1) The total amount of chemical fertilizer per unit area of cotton in Xinjiang increased continuously, and it was higher than the level in most provinces. Since 2016, the amount of cotton fertilizer in Xinjiang tended to slow down and stabilize, and the amount of cotton fertilizer fluctuated around 585 kg N/hm2. (2) From 2000 to 2010, the increase of fertilizer application per unit area positively promoted the increase cotton yield per unit area. While the contribution rate of increasing fertilizer application per unit area to the increase of cotton yield per unit area was -21.29% from 2010 to 2020, indicating that a continuous increase of chemical fertilizer had a negative effect on the increase of cotton yield per unit area. (3) The ecological benefits of the biofertilizer were more prominent, but the economic benefits of the biofertilizer fertilization area were slightly lower than that of the chemical fertilizer area, and the comprehensive benefits of the two fertilizers tended to narrow down with the increase of use years. The average yield per unit area of cotton in the biofertilizer group was 3%-8% lower than that in the chemical fertilizer group, but the incidence of verticillium wilt was significantly reduced in the biofertilizer group and the average decrease in different cotton planting areas was 27.75%-58.20%, soil organic matter content increased by 14.59%-28.54%, and soil microbial quantity increased significantly. The fertilizer cost per acre of biofertilizer was 14%-19% higher than that of chemical fertilizer. The characteristics of biofertilizer require some incentive or ecological compensation policies to guide and raise farmers' environmental awareness at the beginning of the promotion of biofertilizer. It is feasible to reduce the amount of agricultural chemical fertilizer and gradually replace agricultural chemical fertilizer with biofertilizer.
“一带一路”核心区农业碳排放与农业经济增长研究
[J].
Research on agricultural carbon emission and agricultural economic growth in ‘The Belt and Road’ core area
[J].
新疆棉花生产中的重大问题与可持续发展对策
[J].
Some vital problems in cotton countermeasures for achievi production in Xinjiang and the sustainable development
[J].
新疆棉花区划新论
[J].
New theory on cotton regionalization in Xinjiang
[J]
安徽省粮食产量时空格局变化及安全评价
[J].
Spatio-temporal pattern change and safety evaluation of grain yield in Anhui province
[J].
近30年我国谷子生产时空变化与区域优势研究
[J].目的 谷子营养丰富、生育期短、抗旱耐瘠,谷子种植对优化干旱半干旱地区农业种植结构和促进农民增收具有重要作用。分析我国谷子生产时空变化特征与区域优势,以期为优化谷子布局和促进谷子生产发展提供建议与理论依据。方法 基于1985—2015年谷子各省、县域生产统计数据,采用产量贡献率、重心迁移、比较优势指数等指标,分析了我国谷子生产时空变化规律。结果 30年间全国谷子播种面积由3.318×10 <sup>6</sup>hm <sup>2</sup>减少至7.88×10 <sup>5</sup>hm <sup>2</sup>后回升至8.39×10 <sup>5</sup>hm <sup>2</sup>,单产由1 801.2 kg·hm <sup>-2</sup>提高至2 342.9 kg·hm <sup>-2</sup>,总产量变化中面积贡献率为80.3%,单产贡献率为18.4%,且单产贡献率逐渐增加。全国谷子生产重心年际间变化较小,优势产区稳定在东北地区中西部、黄淮海平原中北部和北部中低高原区东南部,具体集中在内蒙东部、东北三省与内蒙接壤的县域、河北大部、河南西北部、山东中部、山西大部、陕西北部、甘肃东部及宁夏中部。30年间黄淮海平原区、东北地区与西北部分县域单产增加但播种面积大量减少,使该区域表现为单产优势与面积劣势,2000年后北部中低高原区的吉林通榆、内蒙敖汉旗与山西部分县域的播种面积回升。播种面积较大而单产劣势的县域集中在黄土高原地区的陕西和山西中北部部分县域。结论 30年来全国谷子播种面积先减后增,生产集中程度不断增大,优势产区趋于稳定,单产逐步提升。黄淮海地区被夏玉米替代的夏谷较难恢复,东北地区中西部、北方农牧交错区及太行山沿线区谷子生产具有恢复潜力。谷子育种、栽培技术与生产加工机械的进步,对谷子生产提质增效与实现产业化发展至关重要。
Spatiotemporal variation and regional advantages of foxtail mitillet production in recent 30 years in China
[J].【Objective】 Foxtail millet (Setariaitalica (L.) P. Beauv.) is rich in nutrition, has a short growth period, and is resistant to drought and barren. Planting foxtail millet plays an important role in optimizing the agricultural planting structure and promoting farmers’ income in arid and semi-arid areas. It was of great significance for the sustainable development of foxtail millet production to analyze the spatiotemporal characteristics and regional advantages of foxtail millet production in China. 【Method】 Based on the provincial and county production statistics of foxtail millet from 1985 to 2015, the spatial and temporal variation rules of foxtail millet production in China were analyzed by using the yield contribution rate, center of gravity migration, comparative advantage index and other indicators.【Result】 In the last thirty years, the sown area of foxtail millet in China decreased from 3.318×10 6hm 2 to 7.88×10 5 hm 2 and then recovered to 8.39×10 5hm 2. The yield increased from 1 801.2 kg·hm -2 to 2 342.9 kg·hm -2. The area contribution rate of total production change was 80.3%, the yield contribution rate was 18.4%, and the yield contribution rate gradually increased. The center of foxtail millet production in China varied little in recent 30 years. The advantageous production areas were stable in the midwest part of northeast China, the north-central part of the North China Plain and the southeastern part of the middle-low plateau area in the north, which were concentrated in the counties bordering Inner Mongolia and the three provinces in northeast China, most of Hebei, northwest Henan, central Shandong, most of Shanxi, northern Shaanxi, eastern Gansu and central Ningxia. In the last thirty years, the yield increased in the North China Plain, the northeast plain and some counties in the northwest area, but the sown area decreased significantly, which made these regions show efficiency advantage and scale disadvantage. After 2000, the sown area of Jilin Tongyu, Inner Mongolia Aohan banner and some counties in Shanxi province in the middle and low plateau area in the north were recovered. The counties with scale advantage and efficiency disadvantage were concentrated in Shaanxi and parts of north-central Shanxi in Loess Plateau area.【Conclusion】 In the past 30 years, the sown area of millet decreased first and then increased, the concentration of foxtail millet production in China had been increasing, the advantageous production areas tended to be stable, and the yield had been gradually increased. The summer foxtail millet replaced by summer corn in North China Plain was difficult to recover, and the foxtail millet production in the midwest regions of northeast China, the northern agro-pastoral interleaving areas and the areas along Taihang mountain had the potential to recover. The progress of foxtail millet breeding, cultivation technology and production processing machinery were very important for improving the quality and efficiency of foxtail millet production and realizing industrialization development.
Change analysis of rice area and production in China during the past three decades
[J].Rice's spatial-temporal distributions, which are critical for agricultural, environmental and food security research, are affected by natural conditions as well as socio-economic developments. Based on multi-source data, an effective model named the Spatial Production Allocation Model (SPAM) which integrates arable land distribution, administrative unit statistics of crop data, agricultural irrigation data and crop suitability data, was used to get a series of spatial distributions of rice area and production with 10-km pixels at a national scale - it was applied from the early 1980s onwards and used to analyze the pattern of spatial and temporal changes. The results show that significant changes occurred in rice in China during 1980-2010. Overall, more than 50% of the rice area decreased, while nearly 70% of rice production increased in the change region during 1980-2010. Spatially, most of the increased area and production were in Northeast China, especially, in Jilin and Heilongjiang; most of the decreased area and production were located in Southeast China, especially, in regions of rapidly urbanization in Guangdong, Fujian and Zhejiang. Thus, the centroid of rice area was moved northeast approximately 230 km since 1980, and rice production about 320 km, which means rice production moved northeastward faster than rice area because of the significant rice yield increase in Northeast China. The results also show that rice area change had a decisive impact on rice production change. About 54.5% of the increase in rice production is due to the expansion of sown area, while around 83.2% of the decrease in rice production is due to contraction of rice area. This implies that rice production increase may be due to area expansion and other non-area factors, but reduced rice production could largely be attributed to rice area decrease.
1950-2015年中国棉花生产时空动态变化
[J].基于1950—2015年中国棉花生产分布数据,综合运用时序变化趋势、空间分析等方法,分析中国棉花产量、面积及单产的时空分布特征和重心迁移轨迹,在此基础上量化面积和单产对棉花产量变化的贡献度。结果表明:① 1950—2015年间,中国棉花产量和单产总体呈上升趋势,产量增加521.44万t,单产增加1381.83 kg/hm<sup>2</sup>,面积经历剧烈波动、平稳发展及3次起落5个时期后,与1950年基本持平;② 棉花产量和面积区域性差距较大,但总体呈增加趋势,单产变化趋势稳定,其中西北内陆棉区棉花生产年际波动最大;③ 1950—2015年中国棉花种植区域中近87%的地区产量增加,约63%的地区棉花面积减少,70%以上地区棉花单产增加。三大棉区产量和单产增加,但增长速率不断减小,西北内陆棉区缩减幅度最小,亦是中国棉花面积增长的主力棉区;④ 中国棉花生产形成“东南—西北”的格局,主产区由黄河流域棉区转为西北内陆棉区;棉花产量和面积重心均向西北方向移动,总移动距离分别为1947 km、1398 km,2010—2015年移动速度最大,分别达到159 km/a、140 km/a;西北内陆棉区生产重心由和田迁至阿克苏,长江流域棉区由六安迁至黄冈,黄河流域棉区则由邯郸迁至聊城;⑤ 全国棉花产量贡献由单产主导逐渐转变为面积主导,从棉区来看,长江和黄河流域棉区亦由单产主导逐渐转变为面积主导,西北内陆棉区则一直为面积主导。
Spatio-temporal changes of cotton production in China from 1950 to 2015
[J].Based on the distribution data of cotton production in China from 1950 to 2015, the study aims to investigate the spatio-temporal changes and gravity center migration path in cotton production, area and yield in China by methods of time-series trend and spatial analysis. Then, contribution rates of cotton area and yield to the changes of cotton production are quantified. The results indicate that: (1) China's cotton production and yield showed an overall upward trend over the past 65 years. Among them, the production increased by 521.44×10⁴ t and the yield increased by 1381.83 kg/hm2. After five periods of violent fluctuations, stable development, and three ups and downs, the cotton area was basically the same compared with the year 1950. (2) There was a large regional gap between cotton yield and cotton area, but the overall trend was increasing. The variation trend of cotton yield per unit area was stable, among which the annual fluctuation of cotton production in the inland cotton area of northwest China was the largest. (3) From 1950 to 2015, nearly 87% of China's cotton-growing regions increased their production, about 63% of the regions decreased cotton area, and more than 70% of the regions increased cotton yield. The production and yield of the three major cotton areas have increased, but the growth rate has been decreasing. The northwest inland cotton area had the smallest shrinkage, and it was also the main area for China's cotton area growth. (4) China's cotton production has formed a "southeast-northwest" pattern. The main production area has changed from the Yellow River basin to the northwest inland; the cotton production and area center of gravity have moved to the northwest, with a total moving distance of 1947 km and 1398 km, respectively. From 2010 to 2015, the moving speed was the highest, reaching 140 km/a and 159 km/a, respectively; the production center of cotton in the northwest inland area moved from Hotan to Aksu. The basin cotton area was moved from Lu'an to Huanggang, and the Yellow River basin cotton area was moved from Handan to Liaocheng. (5) The contribution of national cotton production has gradually changed from yield dominance to area dominance. From the perspective of cotton regions, cotton areas in the Yangtze and Yellow river basins have gradually changed from yield dominance to area dominance, and the northwest inland cotton areas have been driven by area.
新疆棉花种植面积时空格局演变特征及驱动机制研究
[J].新疆棉花种植业发展迅速,已成为新疆国民经济的支柱产业之一,是农民增收的重要途径。对新中国成立以来新疆棉花种植业的调查数据进行统计分析,探究其时序演变规律和空间分布特点,并运用灰色系统关联分析和计量经济学的分析方法,构建棉花种植面积和其影响因素的交互作用关联度模型,定性与定量相结合揭示新疆棉花种植业发展的主要驱动力。研究结果表明:①自1949年以来,新疆棉花种植面积不断扩大,且表现出明显的阶段性和波动性,三大棉区即南疆棉区,北疆棉区,东疆棉区变化特点各异,其中南疆棉区起主导作用。按绿洲划分,以塔里木盆地绿洲棉区和西北沿边绿洲棉区变化明显。②棉花种植面积与各影响因素间的关联度都较强,其中,棉花种植面积与棉花单产的关联度最强;进一步建立作用关系模型,得出其弹性为0.883。③运用以上关联分析结果,将南疆棉区划分为最宜棉区、适宜棉区、不宜棉区3种区域,其中适宜棉区占50%以上,表明目前南疆棉花种植业发展基本合理,但处于不宜棉区的部分县市应该减少棉花种植或退棉,进一步优化农业种植结构。
Spatio-temporal pattern dynamic of cotton plantation in Xinjiang and its driving forces
[J].<FONT face=Verdana>Xinjiang is the biggest cotton planting province in China. The cotton industry has a irreplaceable position in the development of rural economy and regional economy in Xinjiang. Through statistical analysis, the spatio-temporal distribution, main driving factors of cotton plantation dynamic are researched. The cotton plantation area has been increasing quickly since 1949 in Xinjiang, and its variation existed fluctuation and could be divided into several phases. There are three main cotton plantation area in Xinjiang: the South Xinjiang cotton plantation area, the North Xinjiang cotton plantation area, and the East Xinjiang cotton plantation area. The change of the South Xinjiang cotton plantation area was the most obvious. In relation with oasis distribution, the cotton plantation area in the oasis of the Tarim River Basin and the northwest border oasis belt changed obviously. Grey correlation analysis showed the yield per cotton plantation unit area had the most close correlation with cotton plantation area, and the function relationship model showed that the elasticity coefficient is 0.883. According to the associative degree and economic development, the 39 cities and counties in South Xinjiang can be clustered into three types suitable for cotton plantation, namely the most suitable area, suitable area and unsuitable area. The suitable area reaches 50%, and it shows that the development degree of cotton plantation in South Xinjing is suitable at present.</FONT>
新疆棉花种植面积的时空变化及适度规模研究
[J].
Spatio-temporal dynamics and optimal development scale of cotton industry in Xinjiang
[J].
耕地生态安全视域下棉花生产布局优化问题研究——以新疆为例
[J].
A Optimization of the distribution of cotton production in Xinjiang under the view of cultivated land ecological security
[J].
新疆棉花“矮、密、早”栽培历史、现状和展望
[J].新疆棉区通过多年研究和实践,于1994年前后形成基于合理密植、植株矮化、早发早熟的棉花“矮、密、早”栽培模式。该模式以促早发早熟为主攻目标,充分利用地膜覆盖、膜下滴灌、化学调控,以及机械化、信息化等技术手段,并与配套棉花品种结合,通过密植矮化促早管理,促进生长发育与光能利用同步,协调个体与群体矛盾;用群体效应增源、扩库,提高有效光合面积和光合生产能力;克服了春季低温、秋季降温快等不利环境影响。“矮、密、早”栽培模式实现了棉花早发早熟、高产优质,使新疆皮棉产量由1981年的511.5 kg·hm<sup>-2</sup>提高到1994年的1 200.0 kg·hm<sup>-2</sup>,并于2019年达到1 966.5 kg·hm<sup>-2</sup>,年均增产7.2%以上,为中国和世界探寻高产栽培模式提供了典范。本文对“矮、密、早”栽培模式演进过程作了回顾,重点论述了该模式的技术内容和高产机理,并对该模式的发展作了展望,以期为今后棉花栽培模式的不断创新提供参考。
The “Short, Dense and Early” cultivation of cotton in Xinjiang: History, Current Situation and Prospect
[J].
从战略转移看新疆棉花和棉纺产业的发展
[J].
The Development of Xinjiang cotton and cotton textile industry from the perspective of strategic transfer
[J].
加强和完善农业直接补贴措施
[J].
Strengthening and improving direct agricultural subsidies
[J].
新疆2021年棉花生产剖析及未来种业发展方向
[J].
Analysis of cotton production and future development direction of seed industry in Xinjiang in 2021
[J].
目标价格对新疆地方棉区棉花规模的调控效应研究
[J].
The regulatory role of target price on cotton scale in xinjiang local cotton regionv
[J].
新疆棉花全要素生产率测算研究——基于剔除目标价格补贴政策影响的三阶段DEA-Malmquist模型
[J].
Calculation and analysis of total factor productivity of cotton in Xinjiang three-stage DEA-malmquist model based on excluding the influence of target price subsidy policy
[J].
2000-2020年南疆地区棉花种植空间格局及其变化特征分析
[J].
Analysis of the spatial distribution and variation characteristics of cotton planting in southern Xinjiang from 2000 to 2020
[J].
水肥一体化研究进展
[J].【目的】 施肥技术经历了一百多年的发展,目前正处于快速发展阶段。对水肥一体化技术的发展趋势进行了全面的总结和评述,通过减少施肥,减少养分淋失,提高水肥利用率,提高磷、钾等固定元素在土壤中的迁移率。【方法】 顾近50年来水肥一体化技术发展。水肥一体化技术具有提高水分和肥料利用率、有利农业生产可持续发展等诸多优点,不仅能大幅降低肥料用量,减少养分如氮素的淋失损失,增强磷、钾等元素在土壤中的移动性,提高其利用效率,而且还对土壤理化性质有较好的改良作用,保持土壤疏松状态,提高土壤孔隙度,不破坏土壤团粒结构,保持良好的通气性能,有利于作物根系生长发育。水溶肥发展处于非常活跃时期,水溶肥开发趋向于高溶解度、高含量、液态化、全营养的方向发展。综述水肥一体化技术推广应用对化肥减施增效具有重要意义。【结果】 当前,水肥一体化技术发展面临问题:(1)缺乏根据土壤肥力、作物种类、生长时段等为依据个性化订制肥料的发展;(2)水溶肥理化性状与作物种植技术、水肥一体化设施不匹配;(3)水肥一体化技术推广的广度与深度不够。对水肥一体化技术未来发展的展望:应该充分利用水肥一体化装备的便利条件,加强作物营养管理的科学运筹,加强磷钾肥以追施方式施用技术发展,大力推广加注式比例式施肥技术,以提高施肥的精确性。【结论】 加强科学运筹作物营养管理,实施作物生长期动态调控营养管理,推广磷肥以追施的方式施用,使用智能变量施肥管理系统,通过实施水肥一体化技术显著降低化肥用量。
Review on the research progress of water and fertilizer integration
[J].<strong>【Objective】</strong> Fertigation technology, which has experienced a development for more than 100 years, is in a rapid growth now. A comprehensive summary and review of the development trend of water-fertilizer integration technology not only can improve the efficiency of water and fertilizer utilization by reducing fertilizer application and decreasing the leaching losses of nutrients, but it can also improve the mobility of phosphorus, potassium and other immobile elements in soil.<strong>【Methods】</strong> Looking back on the development of water and fertilizer integration technology in the past 50 years, the water and fertilizer integration technology had many advantages, such as increasing water content and fertilizer utilization rate, and being conducive to the sustainable development of agricultural production, which could not only greatly reduce fertilizer use, decrease the loss of nutrients such as nitrogen leaching, enhance the mobility of phosphorus, potassium and other elements in the soil, improve their utilization efficiency, but also improve the physical and chemical properties of the soil, maintain soil loose state, improve soil porosity. All these were beneficial to the growth and development of crop root system without destroying the soil granular structure and at the same time, good ventilation performance was maintained. The development of water-soluble fertilizer is in a very active period. The development of water-soluble fertilizer tends to the direction of high solubility, high content, liquid state and total nutrition. The popularization and application of integrated water and fertilizer technology is of great significance for reducing fertilizer application and increasing efficiency.<strong>【Results】</strong> At present, the development of fertigation is faced with problems:(1) lack of customized fertilizers based on soil fertility, crop types and growth periods; (2) no matching of the physical and chemical characteristics of water-soluble fertilizer with crop planting technology and fertigation facilities; (3) insufficiency of the breadth and depth of the popularization of fertigation. When prospecting for the future development of fertigation technology: it is necessary (i) to strengthen the scientific operation and planning of crop nutrition with the convenient conditions of fertigation equipment; (ii) to strengthen the application of total fertigation on phosphate and potash; and (iii) vigorously to promote the technology of proportional inject fertilization to improve the precision of fertilization.<strong>【Conclusion】</strong> We should strengthen the scientific management of crop nutrition, implement the dynamic regulation and control of nutrition management in crop growth period, popularize the application of phosphate fertilizer in the way of after-application, use intelligent variable-rate fertilization management system, and significantly reduce the use of fertilizer by implementing the integrated technology of water and fertilizer.
