

0 引言
【研究意义】玉米是产量最高的谷类作物之一[1],2011年我国玉米产量超过水稻,成为第一大粮食作物[2-3]。新疆是我国玉米的主要种植区之一。新疆独特的气候使得蒸发量较大,施用水肥不合理会增加土地退化的速度[4],因此,实时监控土地与作物的状态,使用科技手段快速获得农田信息是提产增效的关键。【前人研究进展】我国遥感技术在农业领域的应用已有50余年[5],马仪等[6]将无人机遥感数据与卫星遥感数据相结合,采用两种升尺度法分别对土壤水分进行了反演,发现TsHARP升尺度法对于土壤水分的反演效果较好。郑超磊等[7]基于高分一号卫星遥感数据对16 m分辨率的蒸散发模型进行估算及验证,发现基于高分一号卫星遥感估算的16 m分辨率蒸散发在地表异质性较强的区域更具优势。闫成川等[8]利用Phantom4四旋翼无人机搭载多光谱相机MicaSense RedEdge-M进行不同干旱胁迫下棉花的图像信息采集,利用神经网络进行SPAD值与各波段反射率进行建模预测,将棉田旱情进行了划分。李诗瑶等[9]使用无人机多光谱相机采集了玉米冠层的图像,用于监测不同干旱胁迫下的玉米冠层SPAD值,用于指导灌溉和农田旱灾预警。【本研究切入点】卫星遥感的精度问题导致其对于作物具体生长状态的分析较难实现,而无人机多光谱图像的采集难以剔除除目标物外其他杂质的影响,且国内对于水氮对植株叶片多光谱图像的影响相关研究较少。需研究不同水氮处理对多光谱采集春玉米叶片信息的影响。【拟解决的关键问题】试验采用地基多光谱相机,定点采集玉米植株的叶片信息,解译计算得到植被指数,与实测数据对比分析,采用粒子群优化的反向神经网络进行训练及预测,分析图像采集的精度,为多光谱在农业领域的应用提供理论支撑。
1 材料与方法
1.1 材料
试验于2022年4~10月在新疆克拉玛依市东南部农业区进行(84°55'28″E,45°27'30″N),该农业区耕地面积约为1×10⁴ hm2(15 万亩),其中林区面积0.67×10⁴ hm2(10 万亩),农田面积约为0.33×10⁴ hm2(5万亩),年平均降水量101.1 mm;灌溉主要依赖克拉玛依市西郊水库的地表水,自压管道式的输水保证了灌溉保证率。
表1 土壤酸碱度及微量元素含量
Tab.1
| 土壤深度 Soil depth (cm) | pH值 pH value | 有机质 Organic matter (g/kg) | 全氮 Total nitrogen (g/kg) | 全磷 Total phosphorus (g/kg) | 全钾 Total potassium (g/kg) | 碱解氮 Nitrogen alkali digestion (mg/kg) | 速效磷 Fast-acting phosphorus (mg/kg) | 速效钾 Fast-acting potassium (mg/kg) |
|---|---|---|---|---|---|---|---|---|
| 0~20 | 8.30 | 17.880 | 0.830 | 0.890 | 18.022 | 62.916 | 11.810 | 140.200 |
| 20~40 | 7.88 | 17.283 | 0.787 | 0.879 | 18.000 | 60.123 | 7.540 | 135.200 |
图1
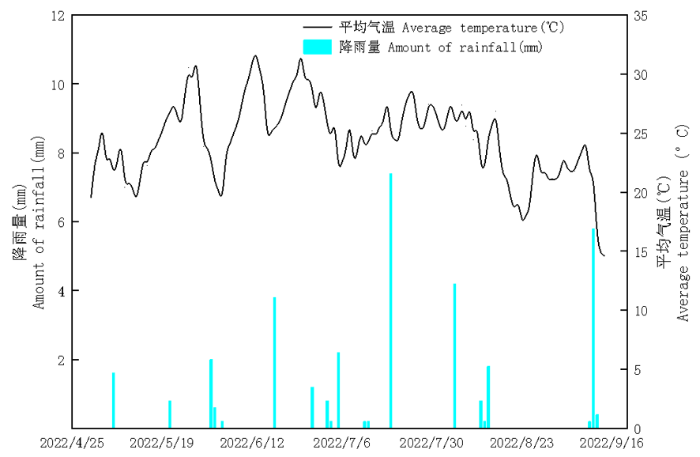
图1
2022年平均气温及降雨量分布
Fig.1
Average temperature and rainfall distribution in 2022
图2
1.2 方法
1.2.1 试验设计
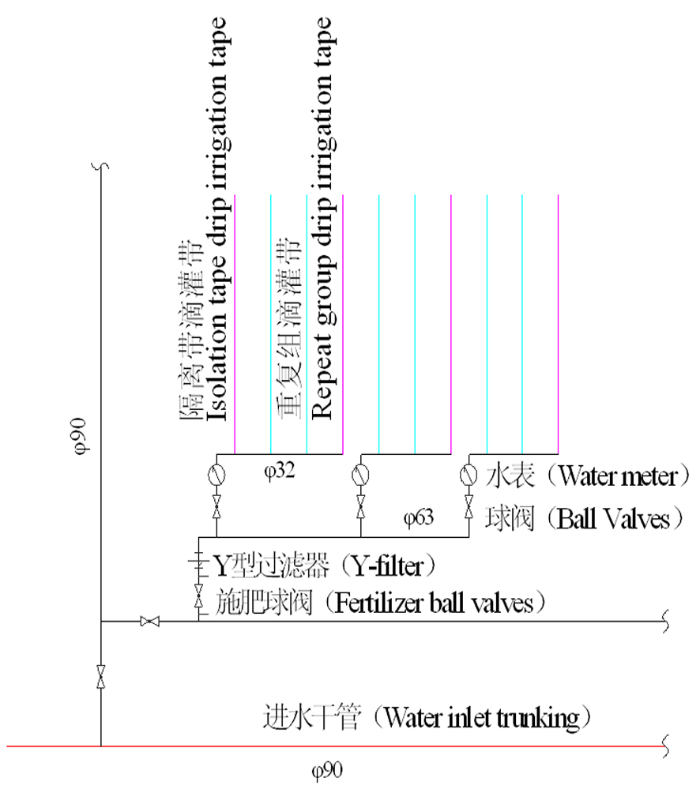
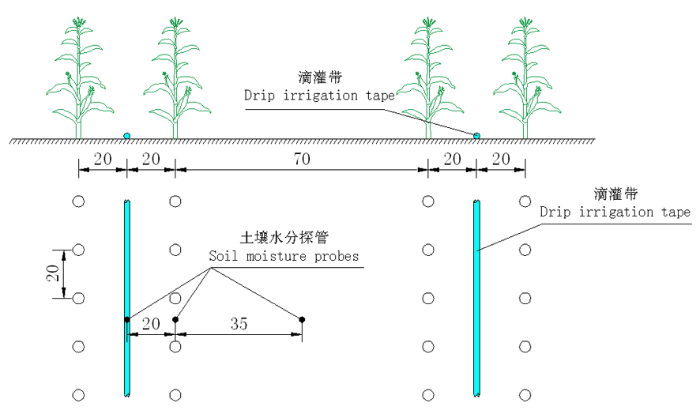
试验区采用裂区形式布置,主要因子为施氮量,次要因子为灌水量,主要因子由压差式施肥罐施肥控制,次要因子由水表控制。玉米种植模式为无膜1管2行,种植间距为(40+70+40)cm,小区长15 m、宽1.1 m,设置3个重复。图3
图3
试验设置12个处理,3个水平的灌水定额(75%、100%、125% ETc)和4个水平的施氮量(0、200、400、600 kg/hm2),每个试验小区设置2行试验处理,左右各1行作为保护行,以免水分交叉,影响试验结果。灌水周期为7 d,灌水量由7 d内的气象数据计算得到ET0,不同生育期选取不同的Kc值,得到ETc指导灌水,施肥分3次施入。表2
表2 试验方案
Tab.2
| 处理名称 Treatments name | 灌水定额 Irrigation quota | 氮肥施用量 Nitrogen fertilizer application rate (kg/hm2) |
|---|---|---|
| W1N1 | 75% ETc | 0 |
| W1N2 | 75% ETc | 200 |
| W1N3 | 75% ETc | 400 |
| W1N4 | 75% ETc | 600 |
| W2N1 | 100% ETc | 0 |
| W2N2 | 100% ETc | 200 |
| W2N3 | 100% ETc | 400 |
| W2N4 | 100% ETc | 600 |
| W3N1 | 125% ETc | 0 |
| W3N2 | 125% ETc | 200 |
| W3N3 | 125% ETc | 400 |
| W3N4 | 125% ETc | 600 |
1.2.2 测定指标
1.2.2.1 气象数据及土壤水分
试验区气象数据由小型HOBO气象站自动采集,灌水前通过气象数据计算得到ETc指导灌水,各个试验小区均由水表控制。在土壤的采集方面,采用Diviner2000土壤水分廓线仪采集,通过提前埋入的预制土壤水分探管测定土壤水分,每10 cm为1层,测定地表0~300 cm的土壤水分数据。表2
1.2.2.2 叶片SPAD值
在玉米主要生育期内,对标记株的多光谱图像采集叶使用SPAD仪测定,在目标叶片的兴趣区内采用五点取样法进行5次测量,测量得到的SPAD值取平均值作为叶片兴趣区的实测值,每株取两片叶子选定兴趣区。
1.2.2.3 多光谱图像采集
采用长光禹辰有限公司生产的多光谱相机MS401采集多光谱图像,采集高度以拍摄物为基准面,相对高度取1.5 m。MS401多光谱相机搭载有4个波段的多光谱镜头,分别为绿波段(550 nm)、红波段(660 nm)、红边波段(720 nm)、近红外波段(840 nm)和一个可见光(RGB)镜头。在玉米的每个生育期内选取10:00~13:00,16:00~18:00间拍摄,减少太阳偏转角对采集的影响。对每个处理组的固定植株的棒三叶采集1次。采集过程中避免阳光直射和阴影遮挡,以减少曝光或阴影的影响。
1.3 数据处理
1.3.1 植被指数的选取
选取5种多光谱植被指数,通过对植株叶片不同波段的反射率采用Yusense Map和Arcgis10.6计算,得到采集兴趣区的植被指数平均值,使用该值和玉米的生长指标进行拟合。表3
表3 植被指数计算
Tab.3
| 植被指数 Vegetation index | 全称 Full name | 计算公式 Calculation formula |
|---|---|---|
| NDVI | 归一化植被指数 | |
| CCCI | 冠层叶绿素含量指数 | |
| GRVI | 比值植被指数 | |
| SAVI | 土壤调整植被指数 | |
| OSAVI | 优化调节土壤植被指数 |
注:NIR为近红外波段反射率,Rrededge为红边波段反射率,R为红外波段反射率,G为绿光波段反射率
Note:NIR is the reflectance in the near-infrared band,Rrededge is the reflectance of the red edge band,R is the reflectance in the infrared band,G is the greed light band reflectance
1.3.2 粒子群优化算法
对群体中每个粒子进行位置、速度和适应度3个指标的赋值,以寻求问题的最优解。其中,在群体中每个粒子都代表了特定问题的一个解,速度决定了粒子的移动方向和距离,适应度表示距离最优解的程度,通过不断地计算粒子的适应度,使其不断接近群体的最优适应度,每次更新位置都进行判断,从而调整每个粒子的方向,最终找到最优解[15]。
假设目标空间为A,空间内存在a个粒子,以Yi=(yi1,yi2,…,yin)来表示i粒子的位置,以Vi=(vi1,vi2,…,vin)来表示i粒子的速度,通过Yi和Vi可以计算i粒子的适应度,用Si=(si1,si2,…,sin)表示i粒子经过的所有最佳位置,用Tj=(tj1,tj2,…,tjn)表示粒子群的最佳位置,粒子速度和位置通过方程(2-7)计算[16]:
式中,n为空间维数,(1,2…n);i为粒子个数(i=1,2…a);x表示迭代次数;b为加速常数,即学习因子;c为取值在(0,1)间的均匀随机数。
1.3.3 BP神经网络
BP神经网络一般包括3层结构,分别是输入层、隐藏层和输出层[17]。输入层选择植被指数,输出层选择SPAD值和土壤水分。
1.3.4 模型评价指标
所获得的数据采用SPSS 27和Excel 2019进行数据的统计分析;使用Origin 2021制图。使用Matlab 2021a将采集图像数据与实测数据进行拟合,建立基于最小二乘的线性回归、PSO-BP神经网络的拟合模型。
对于模型预测结果采用R2评价模型,决定系数R2的值越接近于1,模型拟合效果越好,相关性越高,并根据实测值与预测值间的均方根误差(RMSE)及平均相对误差(MRE)评价模型的准确性和普适性[18]。
式中,i代表第i个样本,Xi代表第i个样本的实测值,Yi代表第i个样本的预测值,
2 结果与分析
2.1 植被指数与SPAD值的相关性
研究表明,相关性由高到低的排列顺序为NDVI>CCCI>GRVI>SAVI>OSAVI。NDVI的适用性较强,除W3N2、W2N3与W3N4处理组外,在其余所有的试验组处理中,均呈显著相关,其中极显著相关的试验组为W2N4,相关性最强,相关系数为0.816。植被指数CCCI与SPAD值有显著相关关系的处理组有5组,分别为W1N2 、W1N3、W3N1、W3N2和W3N3,其中,显著性最强且相关系数最大的是W1N2,为0.898,在灌水水平为W1与W3的情况下,N2和N3的CCCI值与SPAD值间有较好的显著相关关系。在GRVI和SPAD值的分析中仅有4个处理组存在显著的相关关系,分别为W3N1、W3N2、W3N3和W2N4,在GRVI植被指数在灌水水平为W3较为敏感,其中相关系数最大的试验组为W3N3,最大值为0.651。而OSAVI和SAVI与SPAD值进行相关性,所有试验组均不存在显著相关关系,OSAVI和SAVI不适SPAD值的反演,其对于叶片光合色素的相较于其他3个植被指数变化不敏感。
灌水量和施肥量对相关系数的影响不同,从高到低顺序为W1>W2>W3,N2>N1>N3>N4,NDVI在较低的灌水量和较低的施肥量下的敏感度更高,相关性更好。表4
表4 植被指数与SPAD值的相关关系
Tab.4
| 处理名称 Treatments name | 归一化 植被指数 NDVI | 比值植 被指数 GRVI | 优化调节 土壤植被 指数 OSAVI | 土壤 调整植 被指数 SAVI | 冠层 叶绿素 含量指数 CCCI |
|---|---|---|---|---|---|
| W1N1 | 0.630* | 0.307 | 0.4 | 0.4 | 0.303 |
| W2N1 | 0.646* | 0.194 | 0.309 | 0.321 | 0.331 |
| W3N1 | 0.834* | 0.577* | 0.436 | 0.453 | 0.634* |
| W1N2 | 0.910* | 0.433 | 0.173 | 0.181 | 0.898* |
| W2N2 | 0.655* | 0.195 | 0.395 | 0.401 | 0.267 |
| W3N2 | 0.566 | 0.605* | 0.534 | 0.548 | 0.681* |
| W1N3 | 0.636* | 0.077 | 0.353 | 0.368 | 0.584* |
| W2N3 | 0.516 | 0.22 | 0.416 | 0.439 | 0.257 |
| W3N3 | 0.748* | 0.651* | 0.165 | 0.178 | 0.706* |
| W1N4 | 0.591* | 0.357 | 0.192 | 0.2 | 0.342 |
| W2N4 | 0.816** | 0.609* | 0.232 | 0.236 | 0.459 |
| W3N4 | 0.169 | 0.154 | 0.343 | 0.34 | -0.069 |
注:*和**分别代表了在0.05和0.01水平上相关,相关系数|r|<0.5为弱相关,0.5≤|r|≤0.8为中度相关,|r|>0.8为高度相关,下同
Note:* and **reprosent correlations at the 0.05 and 0.01 levels,respectively, a correlation coefficient of |r|<0.5 in dicates weak correlation,0.5≤|r|≤0.8 is moderately correlated,|r|>0.8 is highly correlated,the same as below
2.2 植被指数与表层土壤水分的相关性
研究表明,不同的植被指数与0~20 cm及10~30 cm间的相关关系有较大的差异性,且在植被指数与0~20 cm、10~30 cm的土壤水分的相关关系中,OSAVI及SAVI植被指数的相关关系较好,均与土壤水分呈负相关关系,其中与0~20 cm土壤水分的相关关系由高到低的排序为OSAVI>SAVI>GRVI>NDVI>CCCI,与10~30 cm土壤水分的相关关系由高到低为SAVI>OSAVI>GRVI>CCCI>NDVI。不同深度的土壤水分与植被指数的相关关系存在差异性,OSAVI与0~20 cm土壤水分的相关性较好,但与10~30 cm的土壤水分相关性最好的是SAVI,SAVI更适宜于深层土壤水分的反演。OSAVI、SAVI与表层土壤水分的相关性较为接近,但在N1、N2施氮水平下,OSAVI对于0~20 cm土壤水分的相关关系较强,在N3、N4施氮水平下,两者的差距不大。在N1、N2施氮水平下的OSAVI与SAVI间的差距较小,而在N3、N4施氮水平下,SAVI优于OSAVI。在植株发育中期,天气晴朗,气温较高,植株根系的吸水性增强,0~20 cm的土壤水分的变化程度增强。较低的施氮水平(N1、N2)使得叶绿素的变化较小,同时,植株在温度较高的环境下,对玉米叶片细胞内的液泡的变化影响较大,使得在低施氮水平下(N1、N2),OSAVI与0~20 cm的土壤水分的相关性较强。SAVI放大了近红外波段(NIR)与红外波段(R)的反射率的差异,在较高的施氮水平条件下(N3、N4),叶绿素的变化增强了近红外波段与红外波段的差异,使得SAVI与10~30 cm土壤水分的相关关系增强。 表5,表6
表5 植被指数与0~20 cm土壤水分的相关关系
Tab.5
| 处理名称 Treatments name | 归一化 植被指数 NDVI | 比值植 被指数 GRVI | 优化调节 土壤植被 指数 OSAVI | 土壤 调整植 被指数 SAVI | 冠层 叶绿素 含量指数 CCCI |
|---|---|---|---|---|---|
| W1N1 | 0.696 | 0.614 | -0.761* | -0.740* | 0.578 |
| W2N1 | 0.029 | 0.214 | -0.790* | -0.795* | 0.076 |
| W3N1 | -0.214 | -0.003 | -0.500 | -0.501 | -0.209 |
| W1N2 | 0.016 | -0.391 | -0.868** | -0.880** | 0.227 |
| W2N2 | -0.106 | -0.241 | -0.791 | -0.695 | -0.099 |
| W3N2 | -0.201 | -0.017 | -0.752* | -0.764* | 0.007 |
| W1N3 | 0.046 | 0.439 | -0.529 | -0.533 | 0.067 |
| W2N3 | -0.059 | 0.134 | -0.746* | -0.763* | 0.136 |
| W3N3 | -0.758* | -0.751 | -0.597 | -0.605 | -0.574 |
| W1N4 | -0.399 | -0.403 | -0.677 | -0.667 | -0.479 |
| W2N4 | 0.283 | -0.031 | -0.766* | -0.767* | 0.235 |
| W3N4 | 0.108 | -0.704 | -0.806* | -0.815* | 0.085 |
表6 植被指数与10~30 cm土壤水分的相关关系
Tab.6
| 处理名称 Treatments name | 归一化 植被指数 NDVI | 比值植 被指数 GRVI | 优化调节 土壤植被 指数 OSAVI | 土壤 调整植 被指数 SAVI | 冠层 叶绿素 含量指数 CCCI |
|---|---|---|---|---|---|
| W1N1 | -0.256 | -0.566 | 0.259 | 0.261 | -0.268 |
| W2N1 | -0.129 | 0.141 | -0.689 | -0.695 | 0.058 |
| W3N1 | -0.307 | -0.166 | -0.253 | -0.256 | -0.363 |
| W1N2 | 0.137 | -0.105 | -0.789* | -0.782* | 0.196 |
| W2N2 | 0.039 | 0.18 | -0.728 | -0.716* | -0.022 |
| W3N2 | 0.164 | 0.177 | -0.857** | -0.861** | 0.122 |
| W1N3 | -0.238 | -0.418 | -0.829* | -0.834* | -0.276 |
| W2N3 | -0.145 | -0.13 | -0.901** | -0.910** | -0.158 |
| W3N3 | 0.015 | -0.486 | -0.782 | -0.667 | -0.403 |
| W1N4 | -0.026 | -0.179 | -0.834* | -0.829* | -0.221 |
| W2N4 | -0.483 | -0.550 | -0.446 | -0.448 | -0.721 |
| W3N4 | -0.354 | -0.950** | -0.44 | -0.462 | -0.472 |
2.3 NDVI与SPAD值的变化趋势
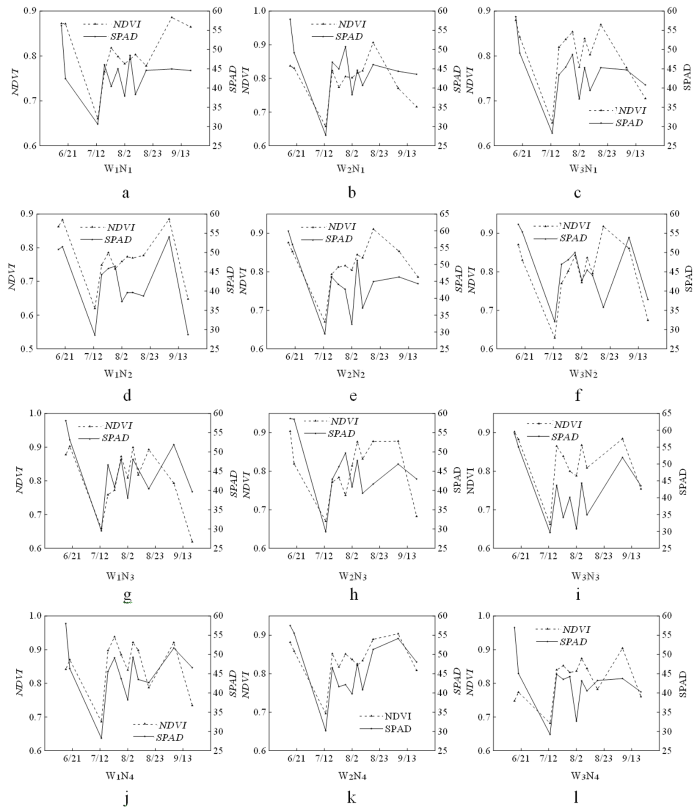
研究表明,NDVI和SPAD值变化表现出高度的一致性。在采集多光谱图像时,选取固定玉米植株的叶片进行拍摄,且由于第一次获取多光谱图像时,玉米植株已经成长至拔节期,此时玉米植株正处于生长发育的关键时期之一,所以SPAD值维持在较高的水平上,试验组处理的初始NDVI值也较高。N1处理的试验组(即不施氮处理组),叶片的SPAD值均在第一次拍摄后迎来骤降,但NDVI值并没有在此次骤降中表现出较强的敏感度。对于近红外波段而言,施氮量不足会导致叶片中细胞变小,细胞间间隙减小,细胞壁的水化程度降低,光在叶片细胞内反射次数减少,使得近红外波段的值降低;在玉米的生育末期,由于需要玉米籽粒达到适宜收割的含水率,因此,在控水处理下,多数植株处于水分胁迫状态,叶绿素含量也急剧下降,红光的反射率增强;表现出植株生长末期的NDVI和SPAD值间差异性增大。
在7月12日~8月23日间,SPAD值和NDVI表现出一致性,此时,玉米植株正处于抽雄散粉期,此时环境温度较高,蒸发量也较大,随着灌水和施氮的增加,玉米植株叶片的SPAD值在一定范围内呈周期性的变化,此时叶片生长较为成熟,叶片细胞数量趋于稳定,使得SPAD值在小范围内波动时,NDVI也表现出随SPAD值变化的一致性。图4
图4
2.4 OSAVI、SAVI与表层土壤水分的变化趋势
研究表明,OSAVI与0~20 cm土壤水分表现相反的变化趋势,呈负相关性。从各个处理的变化趋势来看,在玉米植株发育中期,植被指数OSAVI与土壤水分的响应较为密切;低灌水处理(W1)下,植株生育前期,OSAVI与土壤水分的变化响应较差;高灌水处理(W3)的植株生育末期,OSAVI与实测土壤水分的值趋势差异较大;在植株的生育前期,叶片中叶绿素含量较低,光合色素含量较少,导致红外光(R)的反射率增强,两个波段(NIR和R)均增大,使得OSAVI呈现出不规律的变化,使得OSAVI在低灌水处理(W1)下生育前期的变化趋势产生差异。在高灌水处理(W3)下,生育末期,干枯、衰老的叶片的反射率会降低,同时,叶片的衰老也使得水分大量流失,导致近红外波段(NIR)与红外波段(R)的差距加大,使得在生育末期OSAVI的趋势变化较大,产生较大的差异。图5
图5
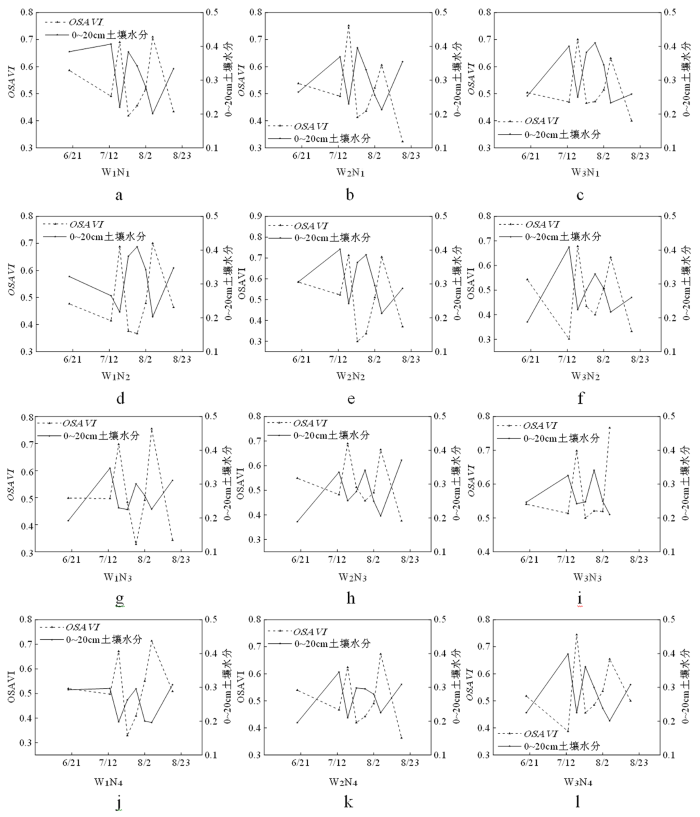
图5
各处理优化调节土壤植被指数0~20 cm土壤水分变化趋势
Fig.5
Trend of soil moisture changes in OSAVI 0 to 20 cm by treatment
研究表明,相对于地表0~20 cm土壤水分的趋势变化,效果较差。在低灌水处理(W1)和高灌水处理(W3)的拟合情况均产生了一定的差异。SAVI与OSAVI相比扩大了近红外波段(NIR)与红外波段(R)间的差值,在低灌水处理(W1)下的土壤水分波动在SAVI指数上的响应不明显,全生育期的趋势均存在一定差异;高氮处理(N4)相较于不施氮处理(N1)趋势较好,高氮处理(N4)下,叶绿素的变化较大,使得红波段(R)变化较大,加强了SAVI对于土壤水分的响应;高灌水处理(W3)的趋势差异性更大,较高的灌水量使得细胞内水分含量较高,降低了近红外波段(NIR)的反射率。图6
图6
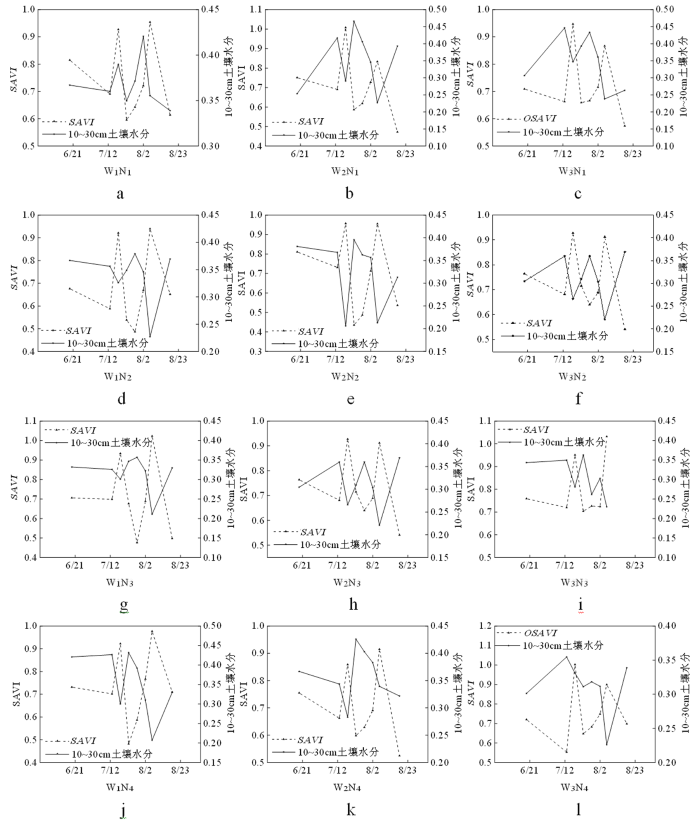
图6
各处理土壤调整植被指数10~30 cm土壤水分变化趋势
Fig.6
Trend of soil moisture changes in SAVI 10 to 30 cm by treatment
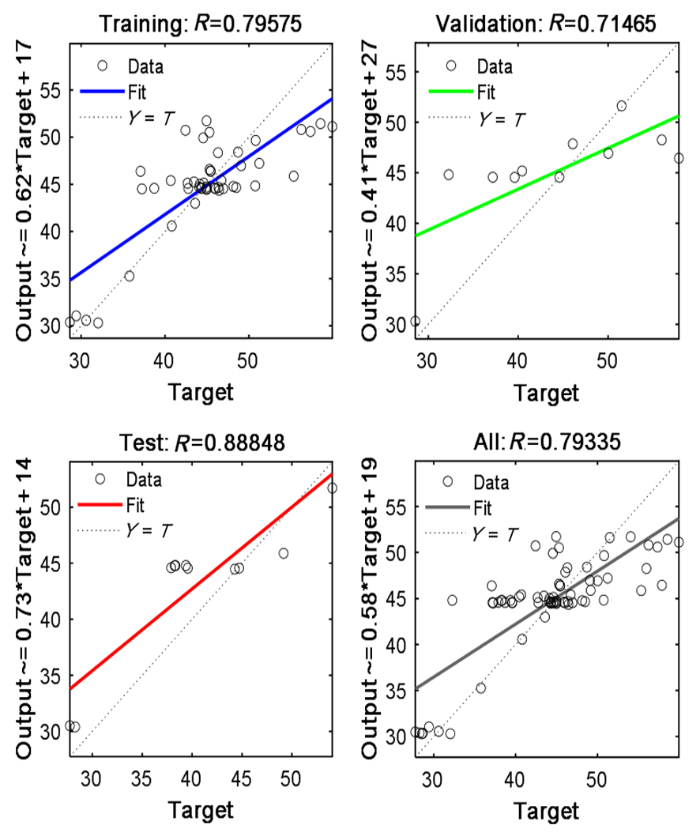
2.5 NDVI与SPAD值的PSO-BP神经网络模型构建
图7
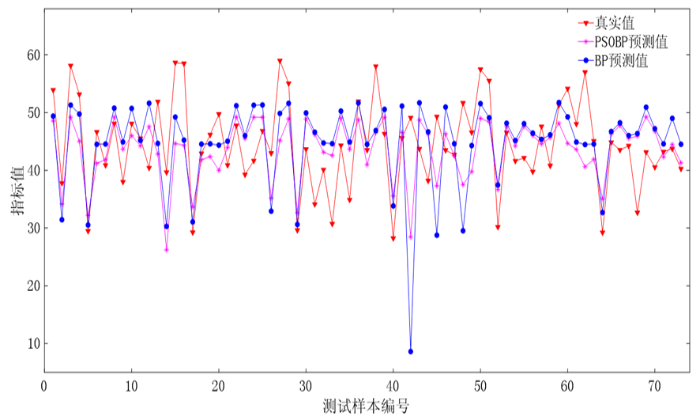
图7
NDVI-SPAD值的BP神经网络与PSO-BP神经网络的预测对比
Fig.7
Comparison of the predictions of the BP neural network with the PSO-BP neural network for NDVI-SPAD values
图8
2.6 OSAVI、SAVI与表层土壤水分的PSO-BP神经网络模型构建
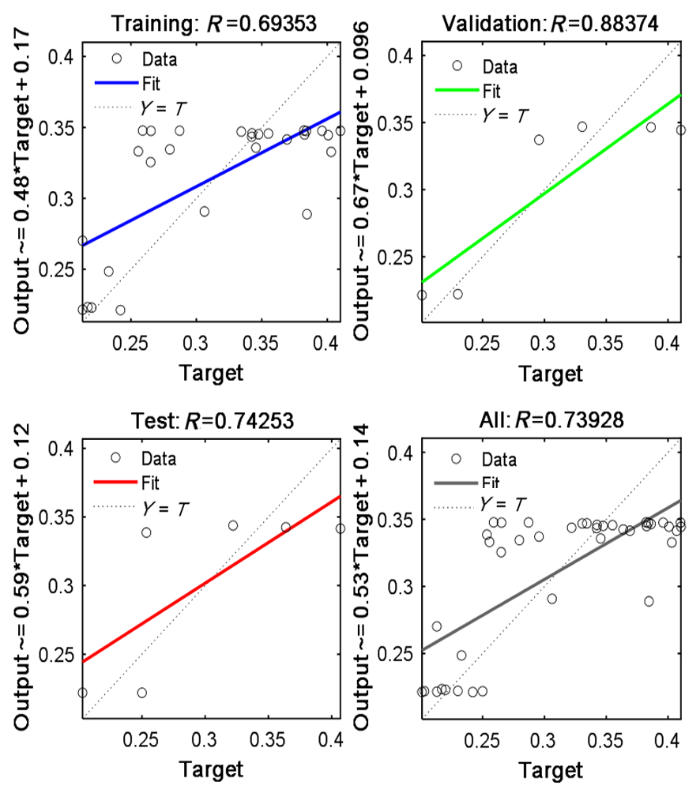
研究表明,PSO-BP神经网络的预测值的变化趋势与实际值的发展趋势更加接近,预测效果更好。训练集的复相关系数R为0.693 5,验证复相关系数R为0.883 7,测试复相关系数R为0.742 5,全部复相关系数R为0.739 3,复相关系数较高,有较好的拟合效果。OSAVI对于0~20 cm土壤水分的预测较为准确。平均绝对误差MAE为0.048 67;均方误差MSE为0.003 621,均方根误差RMSE为0.060 17;传统BP神经网络的平均绝对误差MAE为0.049 80;均方误差MSE为0.004 025;均方根误差RMSE为0.063 44。PSO-BP神经网络对于0~20 cm的土壤水分有着较好的预测效果。图9~10
图9
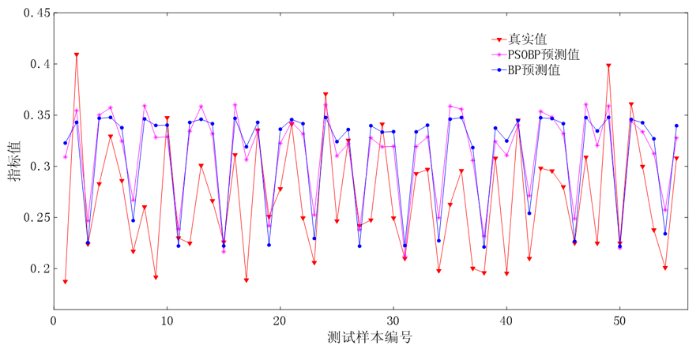
图9
OSAVI-0~20 cm土壤水分BP神经网络与PSO-BP神经网络的预测对比
Fig.9
Comparison of the predictions of OSAVI-0-20 cm soil moisture BP neural network and PSO-BP neural network
图10
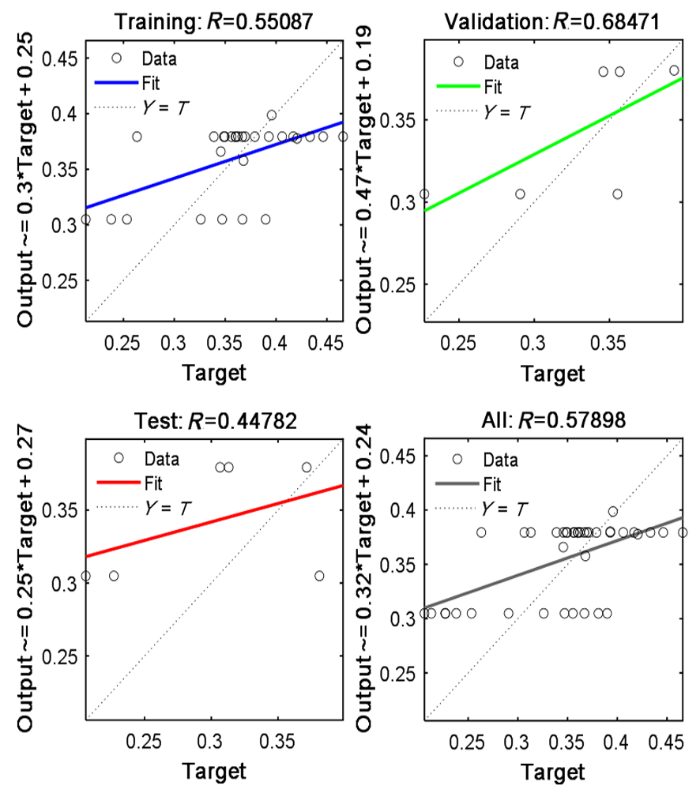
局部的预测结果和实际值间的趋势有紊乱的现象,预测误差也较大。尤其使用BP神经网络的预测结果,展现出较差的趋势性,SAVI对于较深土壤的预测效果较差。SAVI与10~30 cm的土壤水分数据进行训练、验证、预测后,训练集的复相关系数R为0.550 9,验证复相关系数R为0.684 7,测试复相关系数R为0.447 8,全部复相关系数R为0.579 0,复相关系数较低,拟合效果较差。平均绝对误差MAE为0.039 20;均方误差MSE为0.002 184,均方根误差RMSE为0.046 73;传统BP神经网络的平均绝对误差MAE为0.044 70;均方误差MSE为0.002 763;均方根误差RMSE为0.052 56。PSO-BP神经网络对于10~30 cm的土壤水分的预测效果较差。图11~12
图11
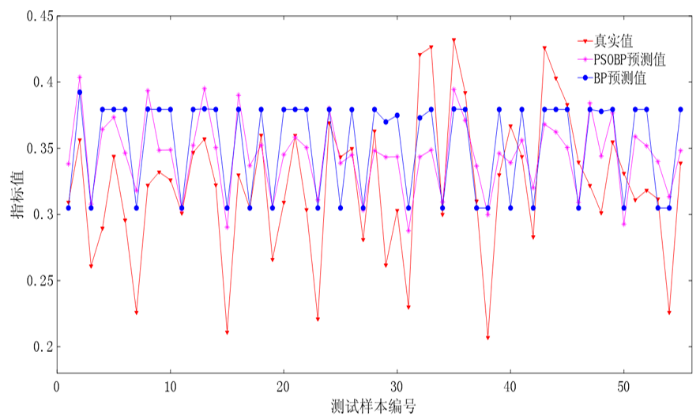
图11
SAVI-10~30 cm土壤水分BP神经网络与PSO-BP神经网络的预测对比
Fig.11
Comparison of the predictions of SAVI-10~30 cm soil moisture BP neural network and PSO-BP neural network
图12
3 讨论
3.1
植株叶片的叶绿素显著下降,使得叶片对于蓝、红波段的吸收减少,反射增强,红波段反射率增强尤为显著[19];红光波段与近红外波段的变化趋势和变化程度有了较大的差异,最终在NDVI的表现上体现出与SPAD值变化的差异较大[20]。水分的胁迫使得叶子细胞壁和细胞空隙变大[21],增加了光在叶片间的反射次数,使得近红外波段的反射率显著增大[22];在低灌水处理的情况下,植株的叶片的水分含量较低,此时细胞中液泡处于相对较小的状态,细胞出现轻度的质壁分离,导致了红外波段(NIR)的反射率增强[23];PSO-BP神经网络的预测值相较于BP神经网络的预测值更加贴近实际[24],BP神经网络的预测值比PSO-BP神经网络的预测值变化更大,波动性也更强。通过PSO-BP神经网络对数据进行训练、验证、预测后。贺露[25]、祝榛[26]等对番茄不同干旱胁迫下的光谱反射率进行研究,发现在不同的水分胁迫下,各反射率的变化不一致,中度干旱和适宜水分条件下反射率较为接近,而重度干旱条件下,在570~700 nm波段反射率升高,700~900 nm波段反射率降低。与研究一致,在W1处理的条件下,NIR波段(840 nm)的反射率降低,R波段(660 nm)的反射率上升,使得两者之间的差值减小,植被指数的值相对减小,但植被指数与土壤水分成反比,植被指数与实测土壤水分间的差异性增加,导致反演结果较差。李庆禄[27]等对渍水胁迫下小麦叶片的光谱特性进行分析,发现渍水群体下的光谱变化与干旱胁迫相似,各波段的光谱反射率均呈现出降低的趋势。在试验中表现为W2处理的反演好于W1与W3处理。试验发现,在高施氮水平下,植被指数的变化趋势与实测数据的变化趋势好于低氮水平,主要得益于施氮水平对叶绿素相关色素的影响,加深了植被指数的响应,这与前人的研究呈现出一致性[28⇓-30]。
3.2
通过粒子群优化BP神经网络可以加快收敛速度,改善网络性能,提高使用度和易于找出最优解[31]。研究中,以植被指数作为输入层构建模型,从结果上看,PSO-BP的神经网络的模型构建效果较好,与BP神经网络的预测相比,降低了预测的极端值,使预测结果更加贴近真实值,预测误差更小。在相对较差的SAVI与10~30 cm土壤水分的预测中,PSO-BP神经网络对于真实值的贴近度更改,BP神经网络对于真实值的预测呈现出随真实值的波动更小,拟合效果更差。
4 结论
4.1
植被指数NDVI与SPAD值的相关关系最佳且适用性较强,与试验组均存在正相关关系。表层土壤水分与植被指数均呈负相关关系,其中与0~20 cm土壤水分的相关关系最好的为OSAVI,与10~30 cm土壤水分的相关关系较高的为SAVI。
4.2
在植株发育中期,NDVI对SPAD值的反演以及OSAVI对0-20cm土壤水分的反演效果均较好。对于表层土壤水分的反演表现出中灌水处理(W2)优于低灌水处理(W1)与高灌水处理(W3)。较高的施氮水平加强了植被指数对作物指标的响应。
4.3
NDVI与SPAD值、OSAVI与0~20 cm的土壤水分数据的PSO-BP神经网络模型构建结果的复相关系数较高分别为0.771 0与0.739 3,NDVI对于SPAD值的预测及OSAVI对于0~20 cm的土壤水分数据较为准确。SAVI与10~30 cm土壤水分的模型复相关系数较低,为0.579 0,拟合效果较差。在100%ETc灌水水平、400 kg/hm2以上施氮水平条件下,使用NDVI与SOAVI来进行SPAD值和地表0~20 cm的土壤水分的反演较为准确。
参考文献
中国玉米产业:发展趋势与政策建议
[J].
China maize industry: development trends and policy suggestions
[J].
中国玉米栽培研究进展与展望
[J].
玉米是全球也是中国第一大作物,在保障国家粮食安全中占有重要地位。当前,面对经济社会的快速发展和人增地减、资源紧缺、生态环境恶化等一系列突出问题,玉米栽培学科正面临着严峻挑战和新的历史发展机遇,在此重要历史关头,回顾中国玉米栽培研究历程和科技进展,探索未来发展方向具有重要的意义。分析表明,经过60年不懈努力,玉米栽培研究的目标已由产量为主向高产、优质、高效、生态、安全等多目标协同发展,研究内容不断拓宽与深入,形成了具有显著中国特色的玉米栽培科学与技术体系。进入21世纪以来,玉米栽培研究进入黄金发展期,在栽培理论、关键技术创新与应用方面取得一系列重要突破,在保障国家粮食安全中发挥了重要的作用。围绕未来玉米生产对科技的需求,依据现代科技的发展趋势,笔者认为高产、优质、高效、生态、安全仍将是未来玉米栽培研究的主要目标,并提出今后20年重点研究的方向与任务:一是继续探索不同生态区玉米产量潜力及突破技术途径,努力提高单产水平;二是转变生产方式,围绕籽粒生产效率,以提高资源利用效率和劳动生产效率为目标,降低生产成本,提高商品质量,增强玉米市场竞争力;适度发展青贮玉米和鲜食玉米等,促进玉米生产向多元化方向发展;三是应对全球气候变化,开展抗逆、减灾、稳产理论和技术研究,实施保护性耕作,实现玉米可持续生产;四是依托现代信息技术,开展智能化栽培技术研究,实现玉米精准生产与管理;五是强化栽培学科基础研究,玉米设计栽培,夯实玉米科技研究和生产发展基础。
Advances and prospects of maize cultivation in China
[J].Maize is the first major crop in China and in the world, it plays an important role in ensuring China’s food security. At present, in the face of the rapid development of economic society and a series of problems such as population growth and land reduction, resources shortage and ecological environment deterioration, maize cultivation science is facing new historic opportunities and challenges. In this crucial historical juncture, it is of great significance to review the scientific research and technical progress of maize cultivation in China and to explore the future development direction. Analysis shows that, the aim of maize cultivation research has been transformed from yield production to collaborative development of high yield, high quality, high efficiency, eco-friendly, security and other goals after 60 years of efforts. The research contents were gradually widened and further deepened with remarkable Chinese characteristics. Since entering into the 21th century, the research of maize cultivation has entered a golden development stage. In this stage, a series of breakthroughs in maize cultivation theory, key technology innovation and application have been achieved, which have taken a positive role in ensuring China’s food security. According to the demand of maize production for science and technology in the future and the development trend of modern science and technology, this article indicated that, in the future, high quality, high efficiency, eco-friendly, security will still be the main objectives of maize cultivation. In this article, the key directions and tasks of maize cultivation research in the next 20 years were put forward: (1) Continue to explore the potential of maize yield in different ecological areas and technologies that can realize these potentials, and make every effort to raise the level of yield per unit; (2) Transform the mode of production and take the improving efficiency of resource utilization and labor productivity as goals, reduce the production costs, improve product quality and the market competitiveness of maize; to develop silage and fresh maize so as to promote the diversified development of maize production; (3) In order to respond to the global climate change, carry out the theoretical and technological researches on yield stability and anti-disaster to realize the sustainable production of maize; (4) Based on modern information technology to carry out the researches of intelligent cultivation technology to achieve maize precise production and management; (5) Strengthen the basic researches of maize cultivation and tamp the researches on maize science and technology and the basement of maize production.
氮水协同对玉米干物质和氮素累积与氮素运移及利用效率的影响
[J].【目的】 研究氮水协同供应对驻玉216品种干物质和氮素累积与分配、氮素运移及利用效率的影响。【方法】 采用裂区试验设计,设置施氮和灌水2个因素,3个灌溉水平W<sub>0</sub>(0 m<sup>3</sup>/hm<sup>2</sup>)、W<sub>1</sub>(750 m<sup>3</sup>/hm<sup>2</sup>)、W<sub>2</sub>(1 500 m<sup>3</sup>/hm<sup>2</sup>);3个施氮水平N<sub>0</sub>(0 kg/hm<sup>2</sup>)、N<sub>1</sub>(150 kg/hm<sup>2</sup>)、N<sub>2</sub>(300 kg/hm<sup>2</sup>)。【结果】 W<sub>2</sub>灌水量(1 500 m<sup>3</sup>/hm<sup>2</sup>)和N<sub>1</sub>施氮量(150 kg/hm<sup>2</sup>)氮水协同供应下成熟期地上部干物质和氮素积累量、氮素吸收效率最高,W<sub>1</sub>灌水量(750 m<sup>3</sup>/hm<sup>2</sup>)和N<sub>1</sub>施氮量(150 kg/hm<sup>2</sup>)氮水协同供应有利于干物质和氮素累积向籽粒内运移,提高营养器官氮素运移量,增加籽粒内的分配比重,提高氮素利用效率、氮素运移效率、氮素运移贡献率、氮肥农学效率和氮肥偏生产力。【结论】 综合籽粒产量与节肥节水因素,灌水量750 m<sup>3</sup>/hm<sup>2</sup>、施氮量150 kg/hm<sup>2</sup>是驻玉216品种灌水施肥最优组合。
Effects of nitrogen and water collaborative supply on accumulation and distribution of dry matter and nitrogen, nitrogen transport and use efficiency of corn
[J].【Objective】 To study the effects of nitrogen and water collaborative supply on accumulation and distribution of dry matter and nitrogen, nitrogen transport and use efficiency of maize hybrid Zhuyu 216.【Methods】 Split plots experiments on two factors of nitrogen and irrigation were designed, and there were three irrigation levels: W0 (0 m3/hm2), W1 (750 m3/hm2) and W2 (1,500 m3/hm2) and three nitrogen application levels: N0 (0 kg/hm2), N1(150 kg/hm2) and N2(300 kg/hm2).【Results】 The results showed that the accumulation of aboveground dry matter and nitrogen at maturity stage, and nitrogen absorption efficiency were the highest under nitrogen and water collaborative supply of W2 water (1,500 m3/hm2) and N1 nitrogen (150 kg/hm2), the collaborative supply of N1 nitrogen (150 kg/hm2) and W1 water (750 m3/hm2) was conducive to the accumulation of dry matter and nitrogen migration into grains, which increased the nitrogen transport amount in vegetative organs, enhanced the distribution proportion in grains, and raised nitrogen use efficiency, nitrogen transport efficiency, nitrogen transport contribution rate, nitrogen agronomic efficiency and nitrogen partial productivity.【Conclusion】 Comprehensively considering the grain yield and fertilizer and water saving factors, the combination of irrigation amount 750 m3/hm2 and nitrogen amount 150 kg/hm2 was the optimal one for maize hybrid Zhuyu 216 based on the experiment results.
我国民用卫星遥感应用现状、问题与趋势
[C]//
Current Situation, Problems and Trends of Remote Sensing Applications of Civilian Satellites in China
[C]//
基于无人机-卫星遥感升尺度的土壤水分监测模型研究
[J/OL].
Soil moisture monitoring model based on UAV-Satellite remote sensing scale-up
[J/OL].
高分一号卫星遥感数据驱动ETMonitor模型估算16 m分辨率蒸散发及验证
[J].
Evapotranspiration estimation and validation at 16 m resolution based on ETMonitor model driven by GF-1 satellite remote sensing datasets
[J].
基于无人机多光谱影像的棉花SPAD值及叶片含水量估测
[J].
Estimation of cotton SPAD value and leaf water content based on UAV multispectral images
[J].
基于无人机多光谱遥感的干旱胁迫下玉米冠层SPAD值监测
[J/OL].
Monitoring of maize canopy SPAD value under drought stress based on UAV multi-spectral remote sensing.
[J/OL].
Effects of Spatial Density of Farmland Shelterbelts on NDVI on the Northern Slope of Tianshan Mountains
[J].
Use of a green channel in remote sensing of global vegetation from EOS-MODIS
[J].
植被盖度及太阳/观测角度对疏勒河上游NDVI和SAVI值的影响
[J].
Influence of PVC and Sun/view geometry on NDVI and SAVI in the upstream regions of Shule River Basin
[J].
基于粒子群优化神经网络的水深反演模型
[J].
A model for water depth retrieval based on neural network optimized by particle swarm optimization
[J].
基于粒子群优化算法与BP神经网络的高铁客运量预测算法
[J].
High speed railway passenger volume prediction algorithm based on particle swarm optimization algorithm and BP neural network
[J].
基于BP神经网络的粳稻种子拉曼光谱鉴别方法研究
[J/OL].
Research on the raman spectroscopic identification of japonica rice seeds based on BP Neural Network
[J/OL].
冬小麦对水分胁迫响应的模型模拟与节水滴灌制度优化
[J/OL].
Modeling the response of winter wheat to deficit drip irrigation for optimizing irrigation schedule
[J/OL].
Effect of light wavelength on biomass, growth, photosynthesis and pigment content of Emiliania huxleyi (Isochrysidales, Cocco-lithophyceae)
[J].
基于FOD和SVMDA-RF的土壤有机质含量高光谱预测
[J].
Estimation of desert soil organic matter through hyperspectra based on fractional-order derivatives and SVMDA-RF
[J].
Adjustments in photosynthesis and leaf water relations are related to changes in cell wall composition in Hordeum vulgare and Triticum aestivum subjected to water deficit stress
[J].
Identifying spectral features of characteristics of Sphagnum to assess the remote sensing potential of peatlands: A case study in China
[J].
控制灌溉下甘蔗叶水势、叶片光谱反射率和土壤含水量的关系
[C]//
The relationship Among sugarcane leaf water potential, leaf spectral reflectance and soil moisture under controlled irrigation
[C]//
Employing artificial bee colony and particle swarm techniques for optimizing a neural network in prediction of heating and cooling loads of residential buildings
[J].
基于高光谱成像技术识别番茄干旱胁迫
[J].
Recognition of drought stress in tomato based on hyperspectral imaging
[J].
基于高光谱成像估测冬小麦不同生育时期水分状况
[J].【目的】研究实时、快速估测冬小麦不同生育时期水分状况并构建模型,为冬小麦水分精准管理提供科学依据。【方法】以新疆典型滴灌冬小麦为研究对象,应用高光谱成像技术获取冬小麦冠层光谱信息,并对原始光谱反射率进行平滑和数据变换,利用一元线性回归(Simple linear regression,SLR)、主成分回归(Principal components regression,PCR)和偏最小二乘回归(Partial least squares regression,PLSR)3种建模方法,对冬小麦冠层原始光谱及变换光谱分别构建植株水分含量估测模型。【结果】冬小麦冠层原始光谱反射率与植株水分含量相关性不高,对原始光谱反射率进行数据变换可以显著增强与水分含量的相关性和相关波段数,其中倒数一阶微分变换与冬小麦植株水分含量的相关系数最大,为-0.893 0,但不同变换最优相关系数所对应的波段位置并不固定。PLSR方法的模型精度最高,对数变换的PLSR模型估测精度最高,模型$R_{p}^{2}$、RMSE<sub>p</sub>、RPD值分别为0.880 8、3.251 2%、2.934 3;冬小麦不同生育时期估测模型精度存在差异,拔节期、抽穗期估测模型精度较低,灌浆中期最高,其估测模型$R_{p}^{2}$、RMSE<sub>p</sub>、RPD值分别为0.904 8、1.381 1%、3.454 7。【结论】利用高光谱成像技术对估测冬小麦植株水分含量是可行的,在灌浆中期的估测效果最佳。
Study on estimation of water status of winter wheat in different growth stages based on hyperspectral imaging
[J].【Objective】 Real-time and rapid acquisition of crop moisture status is extremely important for accurate management of crop water in farmland. 【Methods】 This study took typical drip irrigation winter wheat in Xinjiang as the research object, applied hyperspectral imaging technology to obtain winter wheat canopy spectrum information, and smoothed and conversed the data of the raw spectral reflectance. Simple linear regression (SLR), principal components regression (PCR) and partial least squares regression (PLSR) methods were used to construct plant moisture content estimation models for the raw spectrum and transformed spectrum of winter wheat canopy respectively. 【Results】 The results showed that the correlation between the raw spectral reflectance of winter wheat canopy and the plant moisture content was not high. Data transformation of the raw spectral reflectance significantly enhanced the correlation with the moisture content and the number of relevant bands. Among them, the correlation coefficient between reciprocal first-order differential transformation and winter wheat plant moisture content was the largest, which was -0.893,0. However, the band position corresponding to the maximum correlation coefficient of each transformation was not fixed. Among the three modeling methods, the PLSR method had the highest model accuracy, while the logarithmic transformed PLSR model had the highest estimation accuracy. The model $R_{p}^{2}$, RMSEp and RPD values were 0.880,8, 3.251,2%, and 2.934,3, respectively. There were differences in the estimation model accuracy of winter wheat at different growth stages. The estimation model accuracy of the jointing stage and the heading stage was lower, and the mid-grouting stage was the highest. The estimated model $R_{p}^{2}$, RMSEp and RPD values were 0.904,8, 1.381,1%, 3.454,7, respectively. 【Conclusion】 It is feasible to use hyperspectral imaging technology to estimate the moisture content of winter wheat plants, and the best estimation effect is in the mid-grouting stage.
不同光谱指数反演马铃薯叶片氮累积量的研究
[J].光谱指数作为光谱衍生参数, 可用于反映作物叶片氮累积量状况, 但其因环境与作物而有所不同。本研究在内蒙古察右中旗和杭锦旗, 以马铃薯克新1号与夏波蒂品种为研究对象, 于2016—2018年进行了田间试验, 并在马铃薯生育期间, 用手持式光谱仪(SVC HR-1024i)获取了马铃薯冠层地面观测光谱信息。在前人光谱指数算法的基础上, 通过相关分析对比了22种光谱指数与马铃薯叶片氮累积量(LNA)之间的相关关系, 并利用线性与非线性回归分析建立了马铃薯关键生育时期的氮素营养诊断模型。结果表明, (1)红边区域是反演马铃薯叶片氮素累积量的主要波段, 以715、720、726、734、747 nm构成的Vogelmann红边指数2 (VOG2)、Vogelmann红边指数3 (VOG3)为内蒙古地区马铃薯LNA的敏感光谱指数。(2)苗期、块茎形成期与全生育时期VOG3与LNA的关系符合二次项模型(R <sup>2</sup>>0.75), 以此可以较好地估算不同施氮水平下的马铃薯LNA状况。(3)上述3个模型的均方根误差(RMSE)范围分别为4.04~6.69、9.45~10.89、9.17~13.45 kg hm <sup>-2</sup>, 生育时期对马铃薯叶片氮累积量监测模型的准确性影响较大, 生育后期模型的预测性能变差, 但全生育时期监测模型准确度较高, 因此生育前期分阶段建模与生育后期统一建模可以准确估算马铃薯氮素营养状况, 为光谱指数在马铃薯氮素营养诊断应用提供了理论依据与方法。
Inversion of nitrogen accumulation in potato leaf with different spectral indices
[J].As an important derivative parameter of optical spectrum, spectral index could reflect the leaf nitrogen accumulation of crops. However, the sensitive spectral index varies with different environments and crops. In order to obtain the sensitive spectral index for potato in Inner Mongolia, field experiments were conducted in Chayouzhongqi and Hangjinqi of Inner Mongolia from 2016 to 2018, and during the potato growth period, the canopy spectrum information of potato cultivars Kexin 1 and Shepody was obtained using a handheld spectrometer (SVC HR-1024i). Based on the previous spectral indices algorithm, the correlation coefficients between the leaves nitrogen accumulation of potato (LNA) and each of the 22 spectral indices were compared, and the nitrogen nutrition diagnosis models of potato at critical growth stages were established using linear and nonlinear regression analysis. The results were as follows: (1) the red edge area was the main spectral band for inverting the LNA of potato, and Vogelmann red edge index 2 (VOG2), Vogelmann red edge index 3 (VOG3) were the sensitive spectral indices for potato LNA in Inner Mongolia, which composed of 715, 720, 726, 734, and 747 nm of spectral bands. (2) At the seedling stage, tuber formation stage or whole growth stage, the quadratic regression models (R 2 > 0.75) between VOG3 and LNA could estimate better the LNA of potato under different nitrogen levels using VOG3. (3) The root mean square error (RMSE) of the models was 4.04-6.69, 9.45-10.89, 9.17-13.45 kg hm -2, indicating the accuracy of using the models to predict potato LNA varies with potato growth stage, and it was lower at late growth stages, while it is higher for whole growth duration. In summary, the staged modeling for potato early growth period and the unified modeling for potato later growth period could accurately estimate the potato LNA, which provides a theoretical basis and method for the application of spectral indices in the nitrogen nutrition diagnosis of potato.
基于高光谱指数的叶片尺度叶绿素荧光参数反演
[J].
Retrieval of leaf-scale chlorophyll fluorescence parameters based on hyperspectral index
[J].
