

0 引言
【研究意义】近年来,新疆核桃生产规模和产量增长迅速。但在部分核桃主产地出现年产量下降,空瘪壳率较高等现象,影响收获后的核桃果实品质。核桃生产过程中的施肥管理与果仁品质密切相关。当前核桃品质的检测主要采用对核桃果实收获后再进行检测的方法,具有较大的滞后性,无法满足提前对核桃果实品质监控和预测的需求。氮元素是核桃生长所需的大量营养元素,直接影响核桃果实中的蛋白质含量和核桃果实的内部品质。叶片营养元素含量是植物健康状况的直接反映。传统的植物叶面营养诊断多采用化学检测方法,对叶片组织具有破坏性,耗时较长,检测成本较高,难以适应于当前核桃生产规模快速增长的需求。光谱技术具有快速无损的特点,在植物生理营养检测方面已开展了广泛的研究与应用[1⇓⇓⇓⇓-6]。【前人研究进展】光谱技术具有快速无损的特点,在植物生理营养检测方面已开展了研究与应用[1⇓⇓⇓⇓-6],杨红云等[7]研究了4种施氮水平的水稻叶片光谱信息,采用主成分分析和连续投影算法对预处理后的光谱进行特征降维,应用支持向量机建立水稻氮素营养诊断模型结果表明,模型对水稻氮素营养诊断的识别准确率较高,训练集和预测集准确率分别达99.38%和97.50%。石吉勇等[8]采用高光谱图像并结合化学计量学方法检测叶绿素分布,并提出一种诊断黄瓜叶片氮、镁元素亏缺的方法,对预测集氮、镁元素亏缺正确诊断率达90%。孙小香等[9]测定了水稻冠层光谱反射率及叶片全氮浓度,通过光谱指数筛选建立BP神经网络模型,对水稻叶片氮素浓度进行了估测,其验证集决定系数达到0.859,均方根误差为0.302%。庄红梅等[10]采用叶片光谱指数诊断芜菁叶片氮元素敏感时期,发现不同芜菁氮素光谱营养诊断的敏感时期与光谱指数(ND705)之间均存在显著差异(P<0.05)或者极显著差异(P<0.01)。张瑶[11] 采集了苹果叶片在坐果期、生理落果期、果实成熟期的叶片光谱信息,建立了针对叶片氮元素含量的植被指数,实现了叶片氮元素含量的估测。【本研究切入点】传统的植物叶面营养诊断多采用化学检测方法,对叶片组织具有破坏性,耗时较长,检测成本较高,难以适应于当前核桃生产规模快速增长的需求。当前针对叶片氮元素含量的估测研究较为集中。例如采用适当的光谱参数和特征波段,在小麦[12⇓-14]、水稻[15,16]、玉米[17⇓-19]、核桃[20]、红枣[21]、杏[22]、番茄[23]、生菜[24]等。已有基于光谱特征参量的核桃叶片氮素含量估测模型研究[20],并达到了较高的精度,但针对核桃叶片光谱的预处理方法及采用光谱特征波段对核桃叶片氮元素含量进行预测得研究仍然较少。采用适当的光谱参数和特征波段,可使作物叶片的元素含量估测达到较高的精度,并可进一步建立光谱参数及特征波段与作物果实品质指标间的联系,实现对作物果实品质的监控和预测。针对核桃叶片光谱的预处理方法及采用光谱特征波段对核桃叶片氮元素含量进行预测得研究仍然较少。需研究核桃叶片氮元素含量的光谱预测模型有重要意义。【拟解决的关键问题】采用光谱分析方法研究核桃叶片氮元素含量与光谱特征间的关系,建立基于光谱特征波段的核桃叶片氮元素含量预测模型,为核桃生产中实时快速的施肥管理及后续研究中建立核桃叶片光谱特征与果实内部品质间的关系提供参考。
1 材料与方法
1.1 材料
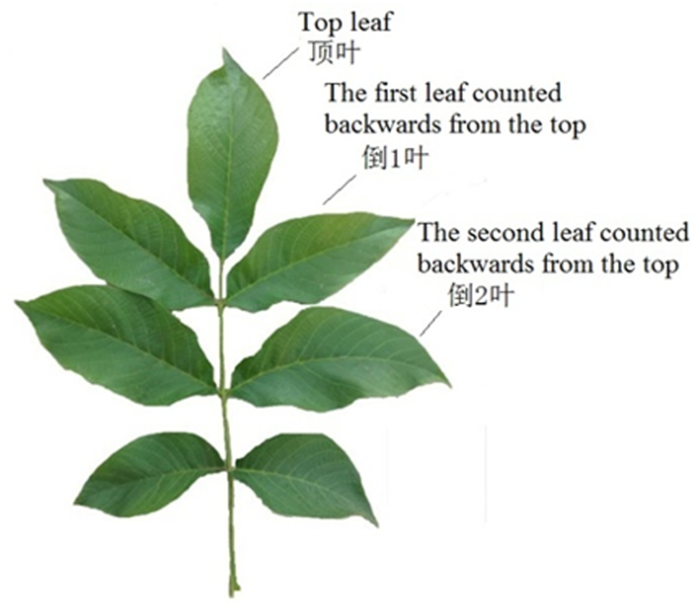
核桃叶片样品采集地点为新疆喀什地区叶城县夏合甫乡核桃生产示范园,位于叶城县城区西北方向约13 km。该地为温带大陆性干旱气候,年平均气温11.3℃,平均年降水量54 mm,平均年无霜期228 d,水土条件良好,光热资源丰富,适合核桃生长。生产示范园面积6 hm2(90亩),核桃种植株行距为5 m×6 m,树龄7~9 a,林相整齐,未与其他农作物间作,种植的温185和新新22个品种互为授粉树。核桃叶片样品采集时间为7月中旬。选取园内长势较好的5颗树采样。分别在同一颗树的东、西、南、北4个方向采集当年新生叶梢中无病虫害及破损的叶片,每个叶梢采集顶叶、倒1叶、倒2叶各1片。每棵树在每个方向采集10个叶梢,得到顶叶、倒1叶、倒2叶叶样各1份,每份叶样包含10个叶片,共采集叶样60份。图1
图1
1.2 方法
1.2.1 光谱采集
叶片采集后立即在田间进行光谱反射率信息采集。光谱采集仪器为美国ASD公司生产的FieldSpec HandHeld2型便携式地物光谱仪。仪器光谱范围为325~1 075 nm,光谱分辨率为3 nm,采样间隔为1 nm。采集叶片光谱信息时,将光谱仪固定在三角架上,镜头垂直向下,采用黑色底板作为背景;采样前先用标准白板对光谱仪进行校正和优化,然后将擦拭干净的叶片迎光面向上置于光谱仪镜头下方采集光谱信息,采集光谱信息时尽量保证周围无遮挡物以减小环境杂散光的影响。每个叶片采集5组光谱数据,每采集10min对仪器进行1次校正优化。
1.2.2 氮元素检测
采集光谱反射率信息后立即将叶样装入密封的保鲜袋中送往实验室进行化学检测,采用凯氏定氮法检测叶样全氮含量。
1.3 数据处理
采用多种光谱数据预处理方法处理原始光谱数据,包括多元散射校正(MSC)、标准正态化(SNV)、一阶微分(FD)、二阶微分(SD)、Savitzky-Golay卷积平滑滤波(S-G)和小波去噪算法。采用偏最小二乘回归算法(PLSR)建立预处理后的全光谱数据针对氮元素含量的预测模型,随机抽取2/3样本数据作为校正集,剩余样品数据作为验证集,以100次采样的预测模型验证集的平均决定系数R2和验证集均方根误差RMSE作为评价指标,用于对预处理效果评判,优选出适用于核桃叶片氮元素含量预测组合预处理方法。
在MSC预处理的基础上,采用SNV、一阶微分、二阶微分和Savitzky-Golay卷积平滑滤波算法进行预处理,并对比不同预处理方法的预测建模效果,Savitzky-Golay卷积平滑滤波预处理后的数据仍然在首尾两端保留了较多的系统噪声,采用小波去噪算法对Savitzky-Golay卷积平滑滤波预处理后的数据进行处理。采用db4小波函数对数据进行1~4层去噪处理。采用筛选出的特征波段建立核桃叶片氮元素含量的PLSR模型,模型主成分数为5。将样本数据按2∶1的比例划分为校正集与验证集,分别用于PLSR模型的训练与验证。采用预测模型验证集的决定系数R2和均方根误差RMSE作为评价指标,对模型预测效果进行评价和分析。
2 结果与分析
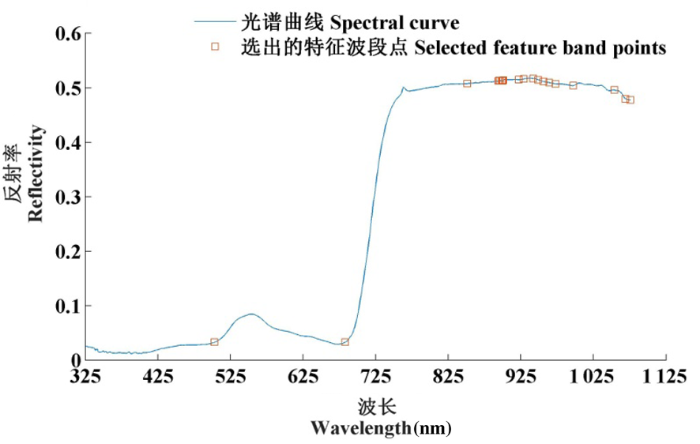
2.1 核桃叶片光谱特征与氮含量化学检测光谱曲线
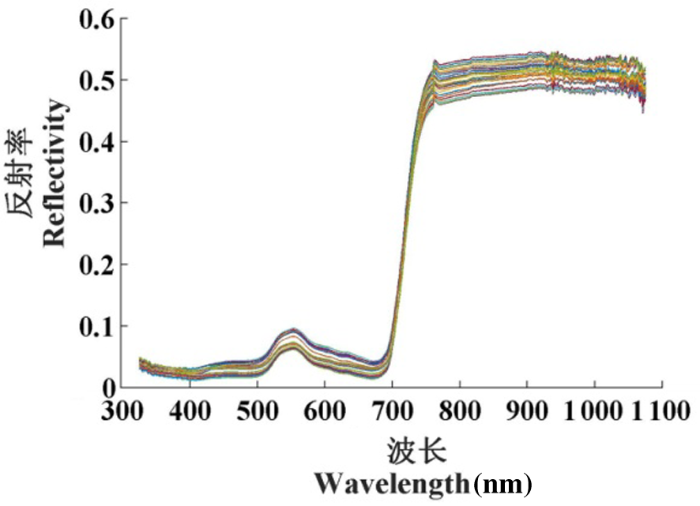
研究表明,在440~460 nm和640~660 nm波段范围内反射率较低,在660 nm的红色光谱附近形成了较明显的低谷(红谷),而在550 nm的绿色光谱附近形成了一个反射峰(绿峰)。在750~1 075 nm的近红外光谱范围内,由于叶片吸光作用较小,形成了一个高反射率的平台,而在680~750 nm波段范围内光谱反射率急剧升高,形成了一个陡峭的红边。由于采用被动式光谱采集方式,受环境噪声和仪器系统噪声影响较大,在光谱数据中含有大量噪声,尤其首尾两端受系统噪声影响较大。图2
图2
核桃叶片样本氮元素含量测量值分布在13.363~22.291 mg/g,均值为19.216 mg/g,标准差为2.54 mg/g。
2.2 光谱预处理
研究表明,采用MSC、SNV、FD、SD、S-G和小波去噪5种方法对原始光谱数据进行预处理,采用处理后的光谱数据建立核桃叶片氮元素含量的全光谱PLSR预测模型。表1
表1 原始光谱与MSC预处理光谱氮元素含量预测建模比较
Tab.1
| 预处理方法 Pretreatment method | PLSR 主成分数 Number of principal components of PLSR | 校正集 Calibration set | 验证集 Validation set | ||
|---|---|---|---|---|---|
| 均方 根误差 RMES (mg/g) | 决定 系数 R2 | 均方 根误差 RMSE (mg/g) | 决定 系数 R2 | ||
| 未处理 None | 5 | 0.644 8 | 0.842 4 | 2.796 4 | 0.596 0 |
| 多元散射校正 MSC | 5 | 0.616 8 | 0.870 3 | 1.411 5 | 0.721 4 |
MSC预处理后的光谱,与原始光谱相比MSC预处理光谱曲线的一致性得到了增强,模型的校正集和验证集决定系数有所提升,均方根误差得到降低:校正集决定系数R2由0.842 4提高到0.870 3;验证集R2由0.59 6提高到0.721 4;校正集均方根误差RMSE由0.644 8减低到0.616 8;验证集RMSE由2.796 4减低到1.411 5。MSC预处理有效的降低了散射光的影响,增强了成分含量相关的光谱有效信息。图3
图3
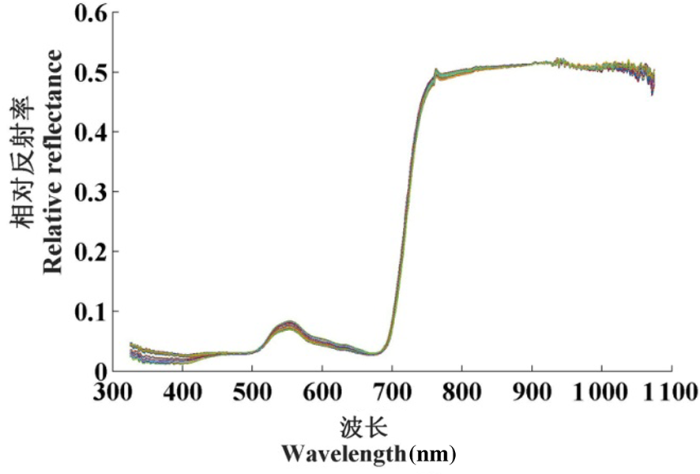
图3
MSC预处理后的核桃叶片光谱曲线
Fig.3
Spectral curve of walnut leaves after MSC pretreatment
SNV预处理光谱的预测建模效果并没有明显提升。采用一阶微分和二阶微分预处理的光谱,模型校正集评价指标有较好的提升,而验证集评价指标明显劣化。当固定拟合多项式阶数为4,窗口宽度取9时,对光谱数据达到了较好的拟合与滤波效果,有效成分相关光谱信息得到了进一步增强:模型校正集R2提高到0.880 1;验证集R2提高到0.756 8;校正集RMSE减低到0.609 7;验证集RMSE减低到1.246。表2
表2 不同光谱预处理方法氮元素含量预测建模比较
Tab.2
| 预处理方法 Pretreatment method | PLSR 主成分数 Number of principal components of PLSR | 校正集 Calibration set | 验证集 Validation set | ||
|---|---|---|---|---|---|
| 均方 根误差 RMES (mg/g) | 决定 系数 R2 | 均方 根误差 RMSE (mg/g) | 决定 系数 R2 | ||
| 标准正态化 SNV | 5 | 0.617 7 | 0.870 8 | 1.443 | 0.723 3 |
| 一阶微分 FD | 5 | 0.221 4 | 0.946 6 | 3.633 5 | 0.404 5 |
| 二阶微分 SD | 5 | 0.332 | 0.930 5 | 3.982 1 | 0.386 1 |
| 卷积平滑滤波 Savitzky- Golay S-G | 5 | 0.609 7 | 0.880 1 | 1.246 | 0.756 8 |
图4
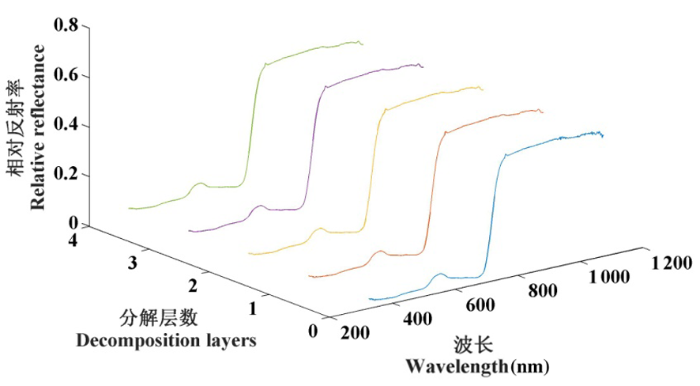
图4
db小波去噪处理的核桃叶片光谱曲线
Fig.4
Spectral curve of walnut leaves processed by db wavelet denoising
表3 不同分解层数小波去噪预处理光谱的氮元素含量预测建模比较
Tab.3
| 分解层数 Decompo sition layers | PLSR 主成分数 Number of principal components of PLSR | 校正集 Calibration set | 验证集 Validation set | ||
|---|---|---|---|---|---|
| 均方 根误差 RMES (mg/g) | 决定 系数 R2 | 均方 根误差 RMSE (mg/g) | 决定 系数 R2 | ||
| 1 | 5 | 0.595 | 0.893 | 1.127 | 0.771 4 |
| 2 | 5 | 0.632 1 | 0.862 4 | 1.471 | 0.728 |
| 3 | 5 | 0.880 3 | 0.791 2 | 2.492 7 | 0.632 3 |
| 4 | 5 | 0.896 4 | 0.796 5 | 2.653 | 0.646 6 |
2.3 核桃叶片氮元素含量特征波段的筛选
图5
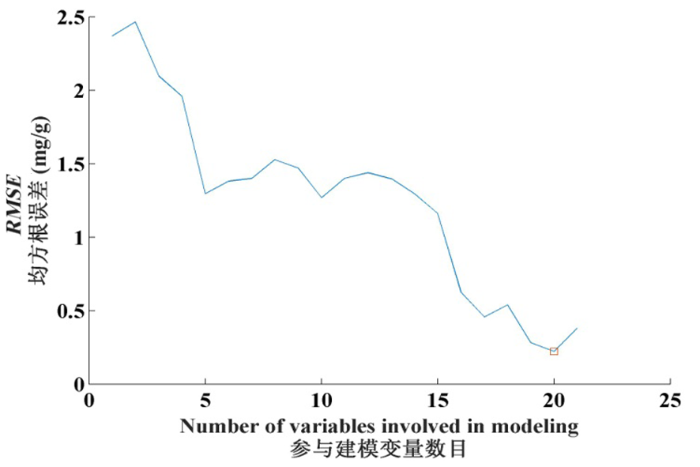
图5
参与建模变量数目下模型均方根误差变化
Fig.5
The Influence of the Number of Variables Participating in Modeling on the Root Mean Square Error of the Model
图6
2.4 特征波段的核桃叶片氮元素含量PLSR预测
研究表明,模型的校正集决定系数R2达到了0.904 2,均方根误差RMSE达到了0.595 mg/g;与全光谱数据相比,验证集决定系数R2由0.771 4提升到了0.875,均方根误差RMSE由1.127 mg/g减低到了0.697 3 mg/g。采用连续投影算法筛选出的特征波段与全光谱数据相比,大幅减少了冗余数据,降低的噪声的影响,提取出了有效成分相关的光谱信息。图7
图7
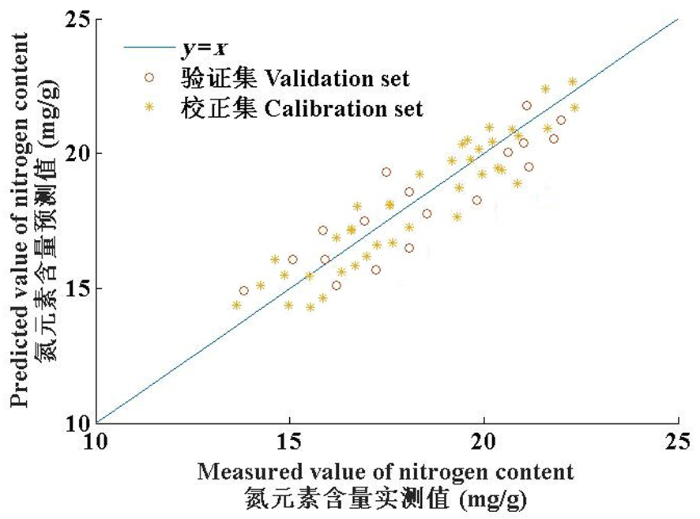
图7
特征波段的PLSR模型氮元素含量预测结果
Fig.7
Prediction results of nitrogen content in PLSR model based on feature wavebands
3 讨论
3.1 在光谱数据的预处理试验中,SNV预处理光谱的预测建模效果并没有明显提升,可能是因为经过MSC预处理后样本表面散射噪声已经得到了较好的消除,而样品外形较一致,不存在表面颗粒大小不同而对反射光谱造成的影响。一阶微分和二阶微分预处理的光谱预测模型验证集评价指标反而劣化,可能是由于微分处理较好的消除了低频噪声的影响,但对高频噪声进行了增强,降低了模型预测效果。Savitzky-Golay卷积平滑滤波算法可以有效降低环境背景及系统噪声的影响,但需要对窗口宽度和拟合多项式阶数进行合适的选择[25,26],通过测试分析,当固定拟合多项式阶数为4,窗口宽度取9时,Savitzky-Golay卷积平滑滤波算法处理效果较好,但仍然在首尾两端保留了较多的系统噪声。小波消噪算法对光谱数据两端保留的系统噪声进行了有效的抑制,但随着分解层数增加时,光谱信息中的有效信息受到损失,模型质量也随之下降[27,28]。确定采用MSC+SG卷积平滑滤波+小波去噪的组合预处理方法,对核桃叶片元素光谱去噪效果较好。
3.3 研究中采用被动式光谱采集方式,受环境和仪器系统噪声影响较大,可能造成光谱数据质量降低,下一步研究中考虑将ASD Handheld地物光谱仪与植物探头及光纤相配套,组建主动式光谱采集系统,进一步提升对核桃叶片氮元素含量的预测效果。
4 结论
4.1 以核桃叶片为研究对象采用核桃叶片光谱信息,开展光谱数据的组合预处理方法研究,针对核桃叶片氮元素含量,建立了基于特征波段的PLSR预测模型。
4.2 核桃叶片氮元素含量的PLSR预测模型验证集R2由0.596增长到了0.771 4, RMSE由2.796 4降低到1.127 mg/g;采用连续投影算法筛选出的特征波段可有效减少了冗余数据和噪声的影响。与全光谱数据相比模型预测效果具有较明显的提升,与全光谱数据相比核桃叶片氮元素含量的PLSR模型预测效果具有较明显的提升,验证集决定系数R2进一步提升到了0.875,均方根误差RMSE减低到了0.697 3 mg/g。
参考文献
Determining the Zn content of cherry in field using VNIR spectroscopy
[J].
Visible and near-infrared (VNIR) spectroscopy is an eco-friendly method used for estimating plant nutrient deficiencies. The aim of this study was to investigate the possibility of using VNIR method for estimating Zn content in cherry orchard leaves under field conditions. The study was conducted in 3 different locations in Isparta region of Turkey. Fifteen cherry orchards containing normal and Zn deficient plants were chosen, and 60 leaf samples were collected from each location. The reflectance spectra of the leaves were measured with an ASD FieldSpec HandHeld spectroradiometer and a plant probe. The Zn contents of leaf samples were predicted through laboratory analysis. The spectral reflectance measurements were used to estimate the Zn levels using stepwise multiple linear regression analysis method. Prediction models were created using the highest coefficient of determination value. The results show that Zn content of cherry trees can be estimated using the VNIR spectroscopic method (87.5<r2<96.79). Moreover, plant nutrient contents can be estimated without using chemicals. However, further research is necessary to develop a standard method for field conditions. Because spectral reflectance is affected by ecological conditions, agricultural applications and nutrient interactions, more effective models must be developed depending on the geographical location, period and plant type.
Estimation of the relative chlorophyll content in spring wheat based on an optimized spectral index
[J].
Estimating biochemical component contents of diverse plant leaves with different kernel based support vector regression models and VNIR spectroscopy
[J].
不同时期香梨叶片铁元素含量高光谱估算模型
[J].
Hyperspectral estimation model of foliar Fe concentration of Pyrus brestschneideri Rehd.in different periods
[J].
基于透射光谱的玉米叶片含水率快速检测仪研究
[J].
Rapid detection of moisture content in maize leaves based on transmission spectrum
[J].
基于PCA-Kmeans聚类法的橡胶树叶片氮含量的近红外高光谱诊断模型研究
[J].
Near infrared hyperspectral diagnostic model for nitrogen content of rubber tree leaves based on PCA kmeans clustering spectrum
[J].
基于高光谱的水稻叶片氮素营养诊断研究
[J].为快速、准确地实现水稻氮素营养诊断,以中嘉早17水稻为试验对象,设置4种施氮水平的水稻栽培试验,利用便携式地物波谱仪获取240组水稻分蘖期顶三叶在350~2 500 nm的光谱数据。随机将样本划分为训练集(160个样本)和测试集(80个样本)。首先,通过多元散射校正(MSC)、变量标准化校正(SNV)、平滑算法(SG)3种方法分别对原始光谱进行预处理;然后,采用主成分分析(PCA)和连续投影算法(SPA)对预处理后的光谱进行特征降维,选取累积贡献率超过99.98%的前24个主成分作为模型的输入变量,对于经过MSC、SNV和SG处理后的光谱数据,还分别筛选出12、15、19个特征波长;最后,应用支持向量机(SVM)基于上述处理分别建立水稻氮素营养诊断模型。结果表明,采用MSC-PCA-SVM模型进行水稻氮素营养诊断的识别准确率最高,其在训练集和预测集上的准确率分别达99.38%和97.50%。
Study on nitrogen nutrition diagnosis of rice leaves based on hyperspectrum
[J].In order to realize rice nitrogen nutrition diagnosis quickly and accurately, rice cultivation experiments with 4 nitrogen application levels were conducted on Zhongjiazao 17 rice cultivar. A total of 240 rice spectral data were collected at tillering stage within 350 to 2 500 nm from top trilobate by using portable earth mass spectrometry. All the samples were randomly divided into training set (160 samples) and prediction set (80 samples). The original spectrum was pretreated by multiplicative scatter correction (MSC), standard normal variate (SNV) and Savitzky-Golay smoothing (SG) methods, respectively. Then, principal component analysis (PCA) and successive projection algorithm (SPA) were used for feature reduction and feature selection of the pre-processed spectra. After principal component analysis, the first 24 principal components, of which the accumulative contribution exceeded 99.98%, were used as the input variables of the model, and 12, 15 and 19 characteristic wavelengths were selected for the spectrum after MSC, SNV and SG treatments, respectively. Finally, rice nitrogen nutrition diagnosis models were established with support vector machine (SVM). It was shown that the MSC-PCA-SVM model was the best method for rice nitrogen nutrition diagnosis, of which the accuracy rate on training set and prediction set was 99.38% and 97.50%, respectively.
基于叶绿素叶面分布特征的黄瓜氮镁元素亏缺快速诊断
[J].
Diagnosis of nitrogen and magnesium deficiencies based on chlorophyll distribution features of cucumber leaf
[J].
基于冠层光谱和BP神经网络的水稻叶片氮素浓度估算模型
[J].
The estimation models of rice leaf nitrogen concentration based on canopy spectrum and BP neural network
[J].
芜菁营养生长期叶片光谱特性及对氮的敏感性
[J].【目的】分析芜菁营养生长期叶片光谱反射率对N的响应,研究采用叶片光谱指数诊断N敏感时期,为新疆芜菁简便快捷的非破坏性N营养诊断提供最佳时间窗。【方法】利用Unispec-SC光谱仪测定不同芜菁幼苗期、叶片生长旺盛期、肉质根生长盛期、成熟期叶片的光谱反射率。【结果】芜菁营养生长期叶片光谱反射率波动取决于波长,在可见光波段的变异最小。芜菁营养生长期不同发育阶段光谱指数(ND<sub>705</sub>)之间均存在显著差异(P<0.05)或者极显著差异(P<0.01)。【结论】叶片生长旺盛期为长黄蔓菁、新星圆蔓菁、美国小芜菁、天地禾芜菁氮素光谱营养诊断的敏感时期,叶片生长旺盛期与肉质根生长盛期为新星圆蔓菁(二代)氮素光谱营养诊断的敏感时期。幼苗期和成熟期可以作为区分几个品种芜菁氮素光谱营养诊断的敏感生育期。
Leaf spectral characteristics and its sensitivity to N in different vegetative growth stages of turnips
[J].【Objective】 The sensitive period of leaf spectral index was studied by analyzing the leaf spectral reflectance in the response to Nitrogen (N) fertilizer at different growing stages of different turnip cultivars in Xinjiang aiming to provide a non-invasive,simple and rapid nutrition diagnosis of N.【Method】The spectral reflectance of different turnip seedling stages, leaf growth exuberant stage, fleshy root growth peak stage and mature stage were measured by Unispec-SC spectrometer with different turnip cultivars as the test material.【Result】The fluctuation of leaf spectral reflectance of different turnip cultivars depended on the wavelengths at all the growing stages,and the least variation was in the range of visible wavelength. The leaf spectrum indexes (ND<sub>705</sub>) of different turnip cultivars were significant (<i>P</i> < 0.05) and extremely significant (<i>P</i> < 0.01) different at all growing stages.【Conclusion】Spectral sensitive period of foliar N concentration varied during different growing stages. The sensitive period for leaf spectral nutrition diagnosis in response to N of long and yellow turnip, Xinxing round turnip, American turnip and Tiandihe turnip were leaf exuberant growth period. The sensitive period for leaf spectral nutrition diagnosis in response to N of Xinxing round turnip (second generation) turnip are leaf exuberant growth period and fleshy root growth stage. The seedling stage and fruit mature period can be used to distinguish several varieties of turnip diagnosis of nitrogen sensitive growth stage.
不同水分处理下冬小麦叶片光谱特征及氮素垂直分布情况分析
[J].
Analysis of spectral characteristics and vertical distribution of nitrogen in winter wheat under different water treatments
[J].
Estimating the leaf nitrogen content with a new feature extracted from the ultra-high spectral and spatial sesolution smages in wheat
[J].Real-time and accurate monitoring of nitrogen content in crops is crucial for precision agriculture. Proximal sensing is the most common technique for monitoring crop traits, but it is often influenced by soil background and shadow effects. However, few studies have investigated the classification of different components of crop canopy, and the performance of spectral and textural indices from different components on estimating leaf nitrogen content (LNC) of wheat remains unexplored. This study aims to investigate a new feature extracted from near-ground hyperspectral imaging data to estimate precisely the LNC of wheat. In field experiments conducted over two years, we collected hyperspectral images at different rates of nitrogen and planting densities for several varieties of wheat throughout the growing season. We used traditional methods of classification (one unsupervised and one supervised method), spectral analysis (SA), textural analysis (TA), and integrated spectral and textural analysis (S-TA) to classify the images obtained as those of soil, panicles, sunlit leaves (SL), and shadowed leaves (SHL). The results show that the S-TA can provide a reasonable compromise between accuracy and efficiency (overall accuracy = 97.8%, Kappa coefficient = 0.971, and run time = 14 min), so the comparative results from S-TA were used to generate four target objects: the whole image (WI), all leaves (AL), SL, and SHL. Then, those objects were used to determine the relationships between the LNC and three types of indices: spectral indices (SIs), textural indices (TIs), and spectral and textural indices (STIs). All AL-derived indices achieved more stable relationships with the LNC than the WI-, SL-, and SHL-derived indices, and the AL-derived STI was the best index for estimating the LNC in terms of both calibration (Rc2 = 0.78, relative root mean-squared error (RRMSEc) = 13.5%) and validation (Rv2 = 0.83, RRMSEv = 10.9%). It suggests that extracting the spectral and textural features of all leaves from near-ground hyperspectral images can precisely estimate the LNC of wheat throughout the growing season. The workflow is promising for the LNC estimation of other crops and could be helpful for precision agriculture.
Estimation of leaf nitrogen content in wheat based on fusion of spectral features and deep features from near infrared hyperspectral imagery
[J].In recent years, the introduction of real-time simulators (RTS) has changed the way of researching the power network. In particular, researchers and system operators (SOs) are now capable of simulating the complete network and of making it interact with the real world thanks to the hardware-in-the-loop (HIL) and digital twin (DT) concepts. Such tools create infinite scenarios in which the network can be tested and virtually monitored to, for example, predict and avoid faults or energy shortages. Furthermore, the real-time monitoring of the network allows estimating the status of the electrical assets and consequently undertake their predictive maintenance. The success of the HIL and DT application relies on the fact that the simulated network elements (cables, generation, accessories, converters, etc.) are correctly modeled and characterized. This is particularly true if the RTS acquisition capabilities are used to enable the HIL and the DT. To this purpose, this work aims at emphasizing the role of a preliminary characterization of the virtual elements inside the RTS system, experimentally verifying how the overall performance is significantly affected by them. To this purpose, a virtual phasor measurement unit (PMU) is tested and characterized to understand its uncertainty contribution. To achieve that, firstly, the characterization of a virtual PMU calibrator is described. Afterward, the virtual PMU calibration is performed, and the results clearly highlight its key role in the overall uncertainty. It is then possible to conclude that the characterization of the virtual elements, or models, inside RTS systems (omitted most of the time) is fundamental to avoid wrong results. The same concepts can be extended to all those fields that exploit HIL and DT capabilities.
氮磷互作对水稻冠层光谱的影响及其PNN识别
[J].【目的】氮、磷均为作物必需的大量营养元素,其丰缺诊断直接关系到合理科学施肥,进而影响产量、效益以及环境。本文旨在研究准确、快捷、无损地区分水稻缺氮和缺磷信息的光谱识别方法,从而指导田间施肥决策,精确作物管理、节约种植成本并控制农田面源污染。【方法】基于水稻6个氮素及两个磷素营养水平交互下的盆栽试验,分别在分蘖、拔节和抽穗期测定水稻冠层的可见近红外反射光谱(350—1 330 nm)及植株全氮(TN)和全磷(TP)含量等数据,分析氮磷互作对水稻植株体内TN和TP含量以及冠层反射光谱的影响,并运用概率神经网络(PNN)分别对不同生育时期的冠层光谱进行氮水平、磷水平、氮磷交互水平和缺素水平4个尺度下的分类识别。为避免光谱测量时仪器误差和光照、风力、温度、水分等环境条件所造成光谱数据批次间的差异,PNN分类识别前对光谱数据进行标准化处理,并将其中2/3作为训练集,另外1/3作为测试集。【结果】植株全氮含量受氮肥、磷肥和氮磷交互作用的影响显著;植株全磷含量则主要受磷肥和氮肥水平的双重影响,但不存在氮磷交互作用。水稻冠层光谱对氮肥的响应规律不受磷肥水平的影响,缺氮使可见光区反射率升高,近红外区反射率下降。缺磷使近红外区反射率下降,但可见光区的响应则受氮肥水平的影响,施氮处理呈上升趋势,氮胁迫处理则呈现分蘖期下降、拔节期上升、抽穗期下降的趋势。利用冠层光谱PNN模型可以对各个生育时期氮水平、磷水平、氮磷交互水平和缺素水平等不同施肥尺度进行识别,拔节期分类精度最高,抽穗期分类精度相对最低。4种分类尺度下PNN模型对磷素水平的分类精度最高,分蘖期和拔节期分别为83%和94%;其次是缺素水平,分别为78%和88%;对氮素水平以及氮磷交互水平等有较多个分类输出的识别精度较低,为61%—75%。值得一提的是,PNN模型对水稻施肥关键生育时期分蘖期和拔节期水稻植株缺氮缺磷、缺氮不缺磷、缺磷不缺氮、不缺氮不缺磷等4种缺素水平的分类中,所有只缺氮处理没有被预测为只缺磷处理,所有只缺磷处理也没有被误判为只缺氮处理,表明冠层光谱PNN模型能有效区分开氮磷胁迫。【结论】水稻的冠层光谱受到氮、磷水平的共同影响,利用水稻冠层光谱建立的PNN模型不仅能分别辨识各氮素、磷素施肥水平,并且能有效地区分开水稻缺磷和缺氮处理,避免混淆,对有目的性的指导施肥具有重要的意义和价值,可避免不恰当的施肥策略造成的环境、产量和经济损失。
Effects of interaction of N and P on rice canopy spectral reflectance and its PNN identification
[J].
Phenotyping flag leaf nitrogen content in rice using a three-band spectral index
[J].
不同品种玉米氮含量与叶片光谱反射率及SPAD值的相关性
[J].
The correlation of total nitrogen content with leaf spectral reflectance and SPAD values in different maize varieties
[J].
Regression modeling nitrogen fertilization requirement for maize crop by combining spectral reflectance and agronomic efficiency
[J].
A nitrogen spectral response model and nitrogen estimation of summer maize during the entire growth period
[J].
基于光谱特征参量的核桃叶片氮素含量估测模型
[J].
Spectral characteristic parameter-based models for foliar nitrogen concentration estimation of Juglans regia
[J].
枣叶片N素质量分数高光谱估算模型
[J].
Hyperspectral estimation model for nitrogen content of jujube leaves
[J].
轮台白杏叶片氮磷钾含量光谱估算模型
[J].
Models for estimating foliar NPK content of armeniaca vulgaris ‘Luntaibaixing’ using spectral reflectance
[J].
Crop reflectance measurements for nitrogen deficiency detection in a soilless tomato crop
[J].
生菜叶片光谱红边参数对氮营养的响应特征分析
[J].
Response features of red edge parameters for lettuce leaf spectra under different nitrogen levels
[J].
SG平滑处理对冬小麦地上干生物量光谱监测的影响
[J].
Effect of SG smoothing processing on predicting the above ground dry biomass of winter wheat
[J].
Vis-NIR光谱模式识别结合SG平滑用于转基因甘蔗育种筛查
[J].
Vis-nir spectroscopic pattern recognition combined with SG smoothing applied to breed screening of transgenic sugarcane
[J].Based on Savitzky-Golay (SG) smoothing screening, principal component analysis (PCA) combined with separately supervised linear discriminant analysis (LDA) and unsupervised hierarchical clustering analysis (HCA) were used for non-destructive visible and near-infrared (Vis-NIR) detection for breed screening of transgenic sugarcane. A random and stability-dependent framework of calibration, prediction, and validation was proposed. A total of 456 samples of sugarcane leaves planting in the elongating stage were collected from the field, which was composed of 306 transgenic (positive) samples containing Bt and Bar gene and 150 non-transgenic (negative) samples. A total of 156 samples (negative 50 and positive 106) were randomly selected as the validation set; the remaining samples (negative 100 and positive 200, a total of 300 samples) were used as the modeling set, and then the modeling set was subdivided into calibration (negative 50 and positive 100, a total of 150 samples) and prediction sets (negative 50 and positive 100, a total of 150 samples) for 50 times. The number of SG smoothing points was ex- panded, while some modes of higher derivative were removed because of small absolute value, and a total of 264 smoothing modes were used for screening. The pairwise combinations of first three principal components were used, and then the optimal combination of principal components was selected according to the model effect. Based on all divisions of calibration and prediction sets and all SG smoothing modes, the SG-PCA-LDA and SG-PCA-HCA models were established, the model parameters were optimized based on the average prediction effect for all divisions to produce modeling stability. Finally, the model validation was performed by validation set. With SG smoothing, the modeling accuracy and stability of PCA-LDA, PCA-HCA were signif- icantly improved. For the optimal SG-PCA-LDA model, the recognition rate of positive and negative validation samples were 94.3%, 96.0%; and were 92.5%, 98.0% for the optimal SG-PCA-LDA model, respectively.Vis-NIR spectro- scopic pattern recognition combined with SG smoothing could be used for accurate recognition of transgenic sugarcane leaves, and provided a convenient screening method for transgenic sugarcane breeding.
温室黄瓜叶片近红外图像消噪算法与含氮量快速检测
[J].
Denoising algorithm of multispectral images and nonlinear estimation ofnitrogen content of cucumber leaves in greenhouse
[J].
The successive projections algorithm for variable selection in spectroscopic multicomponent analysis
[J].
基于连续投影算法的土壤总氮近红外特征波长的选取
[J].
Choice of characteristic near-infrared wavelengths for soil total nitrogen based on successive projection algorithm
[J].The present paper proposed how to select characteristic near-infrared wavelength for soil total nitrogen by using successive projection algorithm (SPA). Spectral data are compressed by SPA in the first place to obtain the raw wavelengths. Then the group of wavelengths derived from SPA is screened by their contributions to the total nitrogen. The insensitive wavelengths for total nitrogen are eliminated, improving the parsimony of the calibration model. For the 85 soil samples in total nitrogen, SPA was used to select the raw wavelengths. After screening on contribution, the number of wavelengths dropped from 12 by direct SPA to 6. Finally, the calibration model using wavelengths selected by screening on contribution after SPA showed the correlation coefficient (R(p)) of 0.913 and the root mean square error of prediction (RMSEP) of 0.011%. This model is as precise as the one before screening on contribution, and more precise than the result derived from partial least square (PLS) for the whole spectrum. The results demonstrate that the number of wavelengths selected by SPA can be reduced without significantly compromising prediction performance using the screening on contribution. The 6 selected total nitrogen wavelengths in this paper can be a reference for designing smart filter NIR spectrometer.
